Internet Banking
Click icon again to close

Treasury

Daily Market Patrol

Market Patrol 28 May 2020

Life is what happens when you're making other plans. 

John Lennon
Indicative Selling Rates
against MUR
USD
19 Apr 2024
  • AUD
  • 30.42
  • 0.6459
  • BWP
  • 3.47
  • 0.0737
  • CAD
  • 34.46
  • 1.3664
  • CNY
  • 6.60
  • 7.1402
  • DKK
  • 6.82
  • 6.9093
  • EUR
  • 50.34
  • 1.0691
  • HKD
  • 6.10
  • 7.7148
  • INR
  • 0.57
  • 82.1874
  • JPY
  • 30.85
  • 152.6385
  • KES
  • 35.97
  • 130.9049
  • NZD
  • 27.96
  • 0.5937
  • NOK
  • 4.35
  • 10.8251
  • SGD
  • 34.91
  • 1.3490
  • ZAR
  • 2.53
  • 18.6446
  • SEK
  • 4.35
  • 10.8361
  • CHF
  • 52.18
  • 1.1081
  • GBP
  • 58.79
  • 1.2484
  • USD
  • 47.09
  • 1.0000
  • AED
  • 13.02
  • 3.6162
EUR/USD extended gains above $1.1000 yesterday boosted by reports the EU commission has proposed a revised covid-induced recovery fund with 500B EUR in grants and 250B EUR in loans.
Fundamental News

EUR/USD
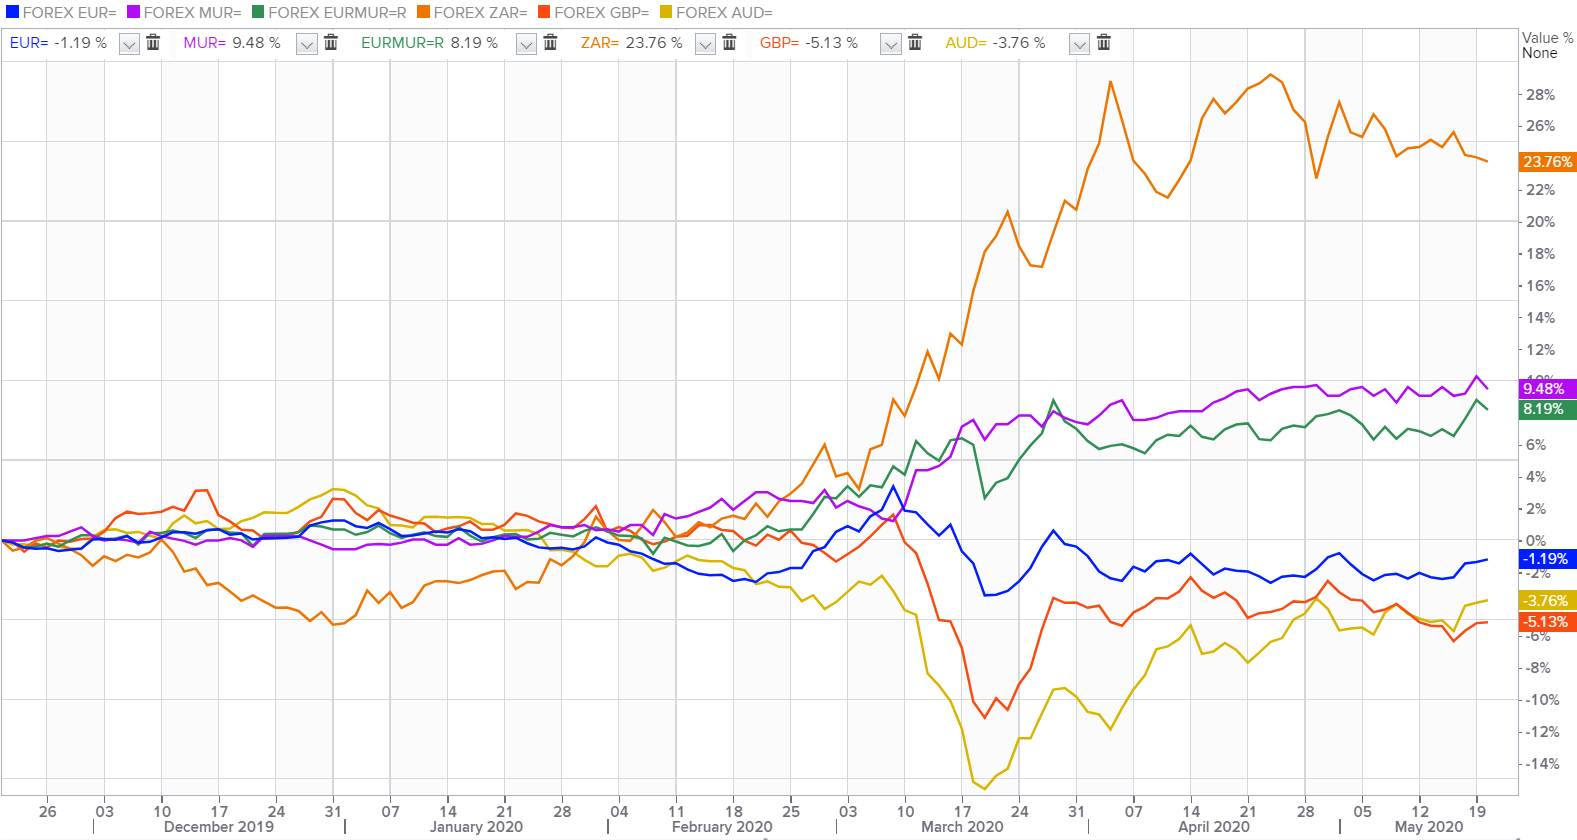
The Single currency extended gains above $1.1000 yesterday boosted by reports the EU commission has proposed a revised 750B EUR recovery fund with 500B EUR available in grants and 250B EUR available in loans. However, the proposed plan is far from a done deal with Austria, Denmark, Sweden, and the Netherlands still opposed to such an extensive grant program.


GBP/USD 
The British Pound fell sharply to a low of $1.2250 on Thursday undermined by prospect of negative interest rates and declining optimism a Brexit deal will be reached before the end of the year.


USD/JPY
The Yen dropped to 107.80 per dollar as hope of a quick rebound in economic activities around the world continues to drive direction.


AUD/USD
The Aussie slipped off multi-month highs from $0.6680 yesterday to $0.6590 this morning on reports China will begin promoting the use of domestic coal reserves and tightening import rules on shipments coming in from Australia.


USD/ZAR
The Rand held onto gains to 17.36 against the greenback despite global weakness in emerging market currencies after the U.S. said Hong Kong lost its autonomy from China, further straining the Sino-U.S relationship


USD/MUR
The USD/MUR little changed at 40.45(selling) on the domestic market.


Fundamental & Technical Data
Economic Indicators-Local Time

16:30 - USD - Core Durable Goods Orders (MoM)(Apr)

16:30 - USD - GDP (QoQ) (Q1)

16:30 - USD - Initial Jobless Claims

18:00 - USD - Pending Home Sales (MoM)(Apr)

19:00 - USD - Crude Oil Inventories 

Central Bank Interest Rates
Last Change
New Meeting
Federal Bank of U.S
0.00-0.25%
16-Mar-2020
10-Jun-2020
European Central Bank
0.00%
10-Mar-2016
04-Jun-2020
Bank of England
0.10%
19-May-2020
18-Jun-2020
Bank of Japan
-0.10%
28-Jan-2016
16-Jun-2020
Reserve Bank of Australia
0.25%
18-Mar-2020
02-Jun-2020
S.Africa Reserve Bank
4.25%
21-May-2020
-
Reserve Bank of India
4.00%
22-May-2020
-
Bank of Mauritius
1.85%
16-Apr-2020
-
Looking for Markets correlation?
Market Correlation is a measure, statistical or observational, that gives a positive or negative link between the pricing of multiple currencies.

Bulls & Bears Levels
Resistance and Support
Levels
EUR/USD
GBP/USD
USD/JPY
USD/ZAR
R3
1.1143
1.2492
108.57
18.40
R2
1.1087
1.2423
108.26
17.81
R1
1.1046
1.2342
107.99
17.99
PP
1.0990
1.2273
107.68
17.50
S1
1.0949
1.2192
107.41
17.23
S2
1.0893
1.2123
107.10
16.58
S3
1.0853
1.2042
106.83
15.92
Technical Analysis - Forex Charts
Safe-haven nature of FRANC SWISS may plummet USD/CHF to a downfall
Chart updated on 13.04.2020
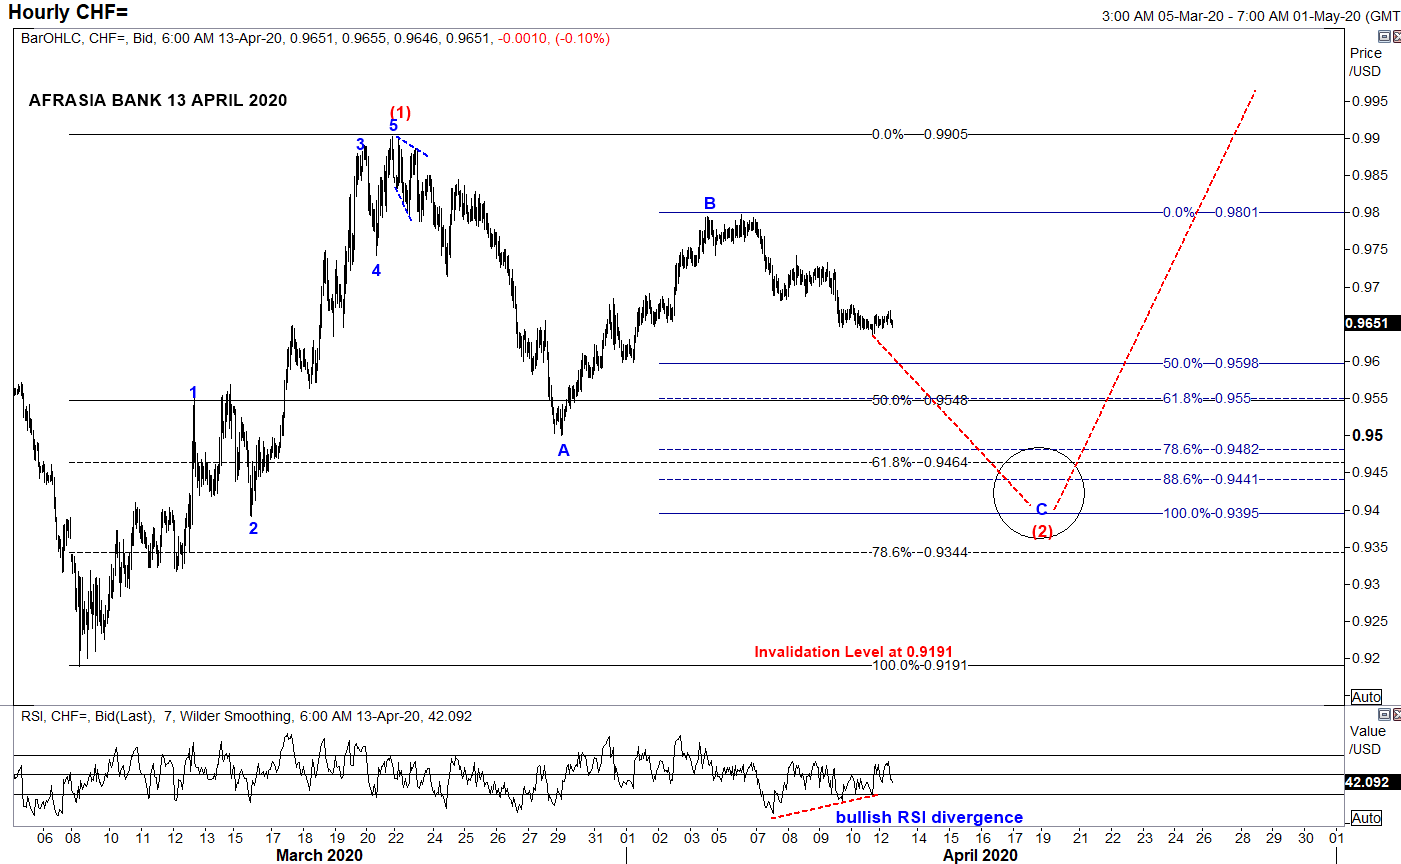
  • From an Elliott Wave standpoint, USDCHF could potentially unfold into compelling impulsive Wave C of the zigzag correction of Wave (2) to a narrowing region 0.9550 (50% retracement of Wave (1)) to 0.9395 (100% projection of Wave A through B) in the near term trend, from the downside bias from April 6th high of 0.9797.
  • Price could immediately start to shoot back up into Wave (3) on a longer perspective.
  • Piercing above the resistance 0.9905 would endorse the structure.
  • Alternatively, broader bearish invalidation of Elliott Wave Structure rest at 0.9191 of March 9th low while Relative Strength Index signals a bullish recoil higher for the pair.
Japanese Yen rebound may fizzle its way back to Safe-haven status
Chart posted on 14.04.2020

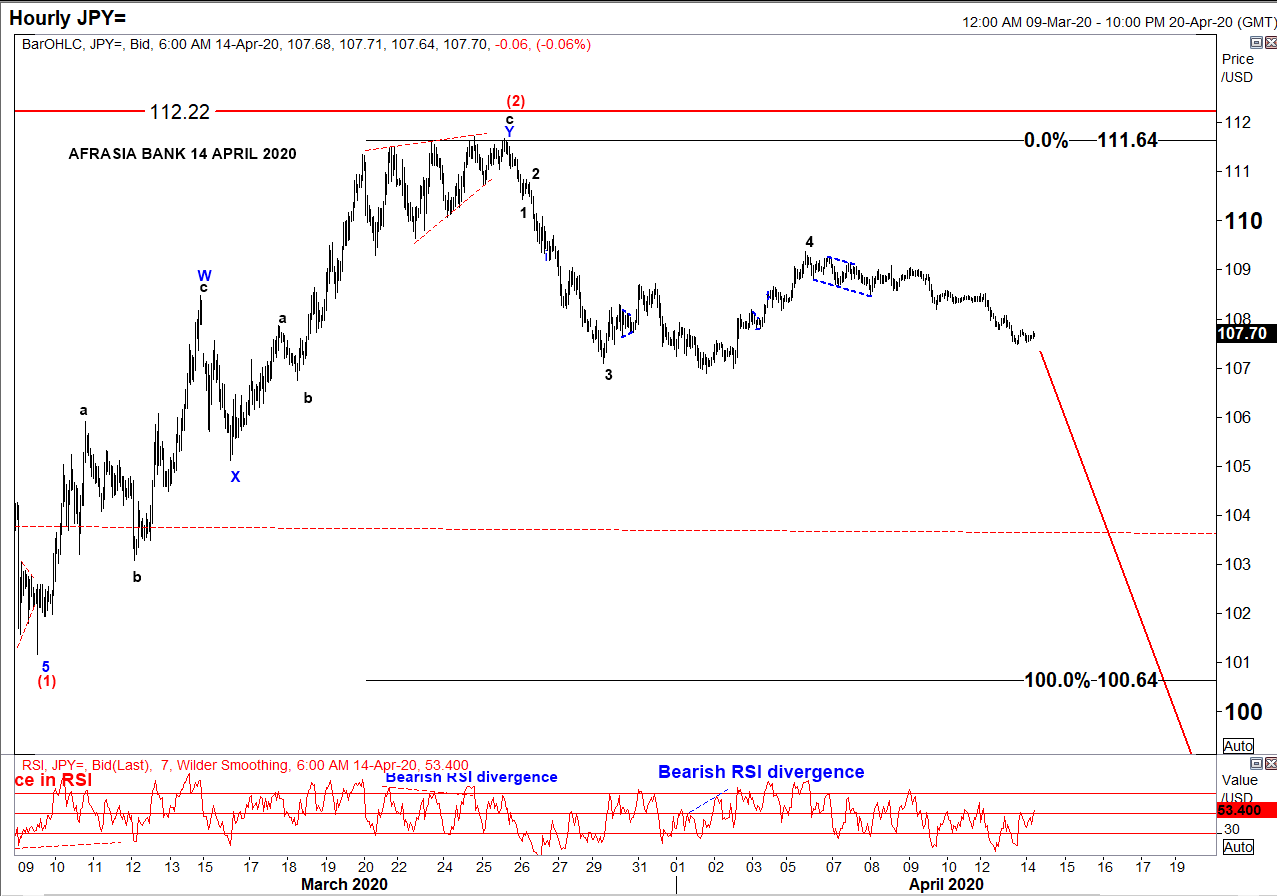
• After rallying to the downside from a high of 112.22 to 101.17 amid global pandemic threat, USD/JPY has been in a correcting mode since 9th March 2020 and seemed to have recently completed an W-X-Y Double Zig-Zag structure of Wave (2) reaching a high of 111.64 on 27th March 2020.
• Two strong indicators were flashing a trend reversal: ending diagonal at Wave 5 of Wave c and bearish RSI divergence.
• On the hourly chart, as per Elliott Wave analysis, the pair might resume its downwards trend targeting 100.64 - 93.78 to unfold Wave (3), a projection of 100%-161.8% of Fibonacci level.
• At 107.70 today, USD/JPY is percolating towards its target from 110.41 to 107.84, as per chart.
• On a side note, resumption of a bullish USD/JPY would mark an invalidation of the Elliott Wave structure above 112.22

Markey update on Biz Week by Christie Ng
Speak to our team
  • Allan Juste
    Head - Forex And Derivatives
    +230 5251 4855
  • Reshma Peerun Rajwani
    Head – Treasury Sales
    +230 403 5500
Disclaimer
Please note that the information published is purely indicative. It is based on technical data from sources which the Bank verily believes to be authentic, though its timeliness or accuracy cannot be warranted or guaranteed. AfrAsia Bank Ltd issues no invitation to anyone to rely on this bulletin and neither we nor our information providers shall be in no way whatsoever, liable for any errors or inaccuracies, regardless of cause, or the lack of timeliness, or for any delay or interruption in the transmission thereof to the user. The indicative rates and other market information are subject to changes at the Bank's discretion. Whilst every effort is made to ensure the information is accurate, you should confirm the latest situation with the Bank prior to making any decisions.