Internet Banking
Click icon again to close

Treasury

Daily Market Patrol

Market Patrol 29 May 2020

Surplus wealth is a sacred trust which its possessor is bound to administer in his lifetime for the good of the community
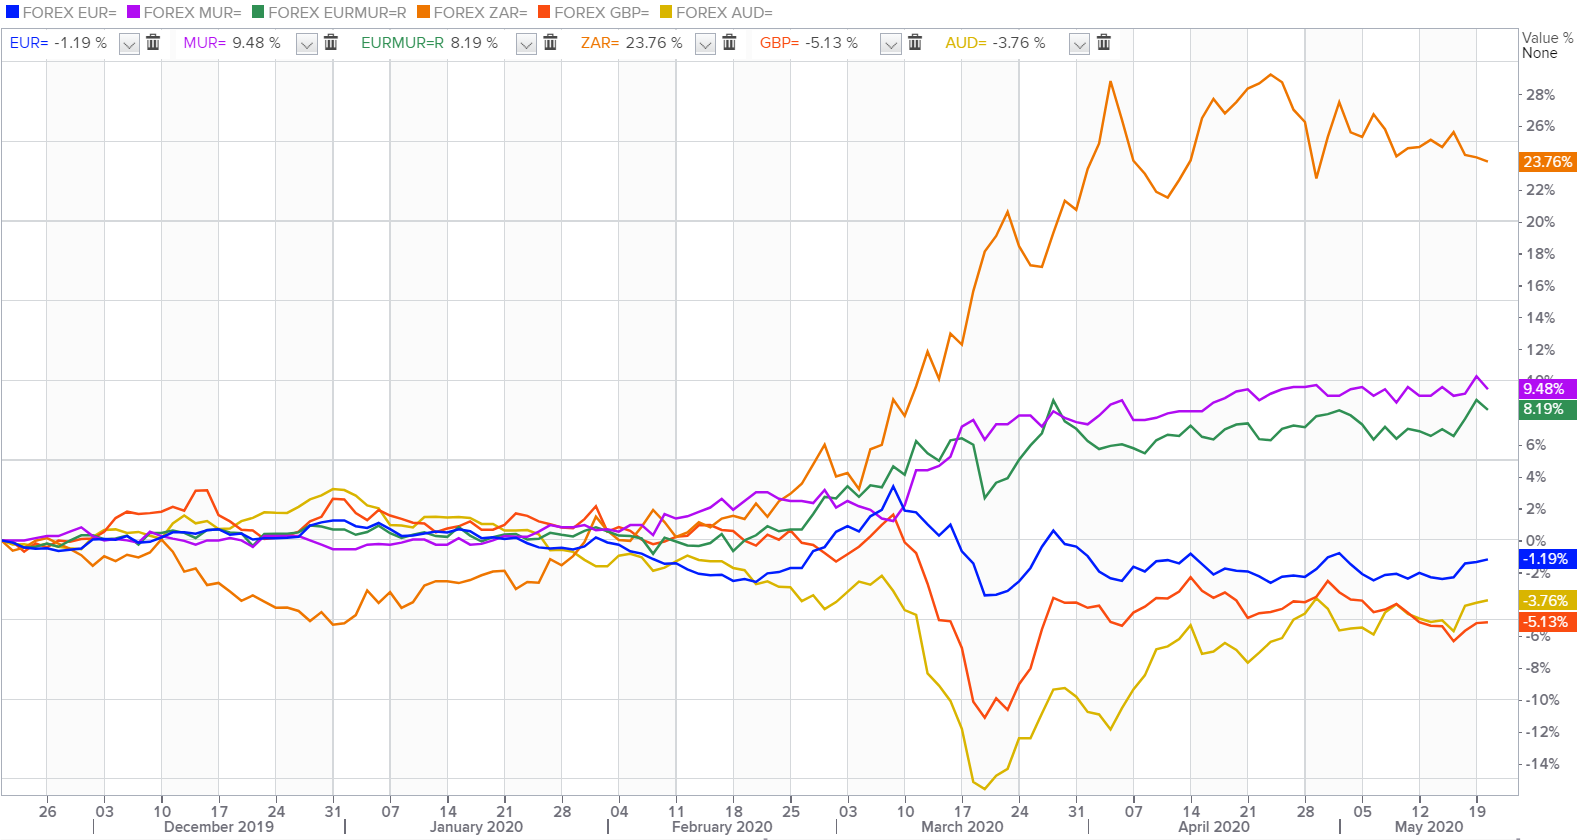
Andrew Carnegie
Indicative Selling Rates
against MUR
USD
24 Apr 2024
  • AUD
  • 30.84
  • 0.6580
  • BWP
  • 3.43
  • 0.0732
  • CAD
  • 34.58
  • 1.3552
  • CNY
  • 6.56
  • 7.1461
  • DKK
  • 6.83
  • 6.8651
  • EUR
  • 50.42
  • 1.0758
  • HKD
  • 6.07
  • 7.7178
  • INR
  • 0.57
  • 81.9769
  • JPY
  • 30.62
  • 153.0506
  • KES
  • 35.48
  • 132.1115
  • NZD
  • 28.11
  • 0.5997
  • NOK
  • 4.40
  • 10.6625
  • SGD
  • 34.83
  • 1.3457
  • ZAR
  • 2.54
  • 18.4847
  • SEK
  • 4.40
  • 10.6565
  • CHF
  • 51.73
  • 1.1037
  • GBP
  • 58.66
  • 1.2515
  • USD
  • 46.87
  • 1.0000
  • AED
  • 12.96
  • 3.6156
The U.S dollar plunged amid fears on Trump’s administration retaliation this evening after China imposed the controversial national security bill on Hong Kong on Thursday.
Fundamental News

EUR/USD
The Single currency perched at a 2-month high at $1.1100 as the EU’s announcement of a 750B EUR coronavirus recovery fund fueled optimism about the euro-zone economy.


GBP/USD 
The Pound is on course for its second weekly gains at $1.2340 supported by broad selling in the U.S dollar this week.


USD/JPY
The Japanese Yen spiked to 107.13 per dollar after Japan CPI data smashed estimates on Friday, while risk-aversion provided additional support to the Yen.


AUD/USD
The Aussie held weekly gains at $0.6643 although Sino-US friction raised a potential pitfall later in the session. U.S President Donald Trump will hold a news conference on China this Friday at 18:00 GMT


USD/ZAR
The Rand fell to 17.47 against the greenback as Sino-U.S friction dented risk appetite.


USD/MUR
The USD/MUR kept the wait and see mode at 40.45(selling) on Friday despite a weakening U.S dollar across the board

Fundamental & Technical Data
Economic Indicators-Local Time

13:00 - EUR - CPI (ÝoY)

16:30 - GDP (MoM)(Mar)

19:00 - USD - Fed Chair Powell Speaks

Central Bank Interest Rates
Last Change
New Meeting
Federal Bank of U.S
0.00-0.25%
16-Mar-2020
10-Jun-2020
European Central Bank
0.00%
10-Mar-2016
04-Jun-2020
Bank of England
0.10%
19-May-2020
18-Jun-2020
Bank of Japan
-0.10%
28-Jan-2016
16-Jun-2020
Reserve Bank of Australia
0.25%
18-Mar-2020
02-Jun-2020
S.Africa Reserve Bank
4.25%
21-May-2020
-
Reserve Bank of India
4.00%
22-May-2020
-
Bank of Mauritius
1.85%
16-Apr-2020
-
Looking for Markets correlation?
Market Correlation is a measure, statistical or observational, that gives a positive or negative link between the pricing of multiple currencies.

Bulls & Bears Levels
Resistance and Support
Levels
EUR/USD
GBP/USD
USD/JPY
USD/ZAR
R3
1.1218
1.2476
108.17
18.40
R2
1.1156
1.2410
108.04
17.81
R1
1.1117
1.2365
107.84
17.99
PP
1.1054
1.2299
107.71
17.50
S1
1.1015
1.2254
107.51
17.23
S2
1.0953
1.2189
107.38
16.58
S3
1.0913
1.2143
107.18
15.92
Technical Analysis - Forex Charts
Safe-haven nature of FRANC SWISS may plummet USD/CHF to a downfall
Chart updated on 13.04.2020
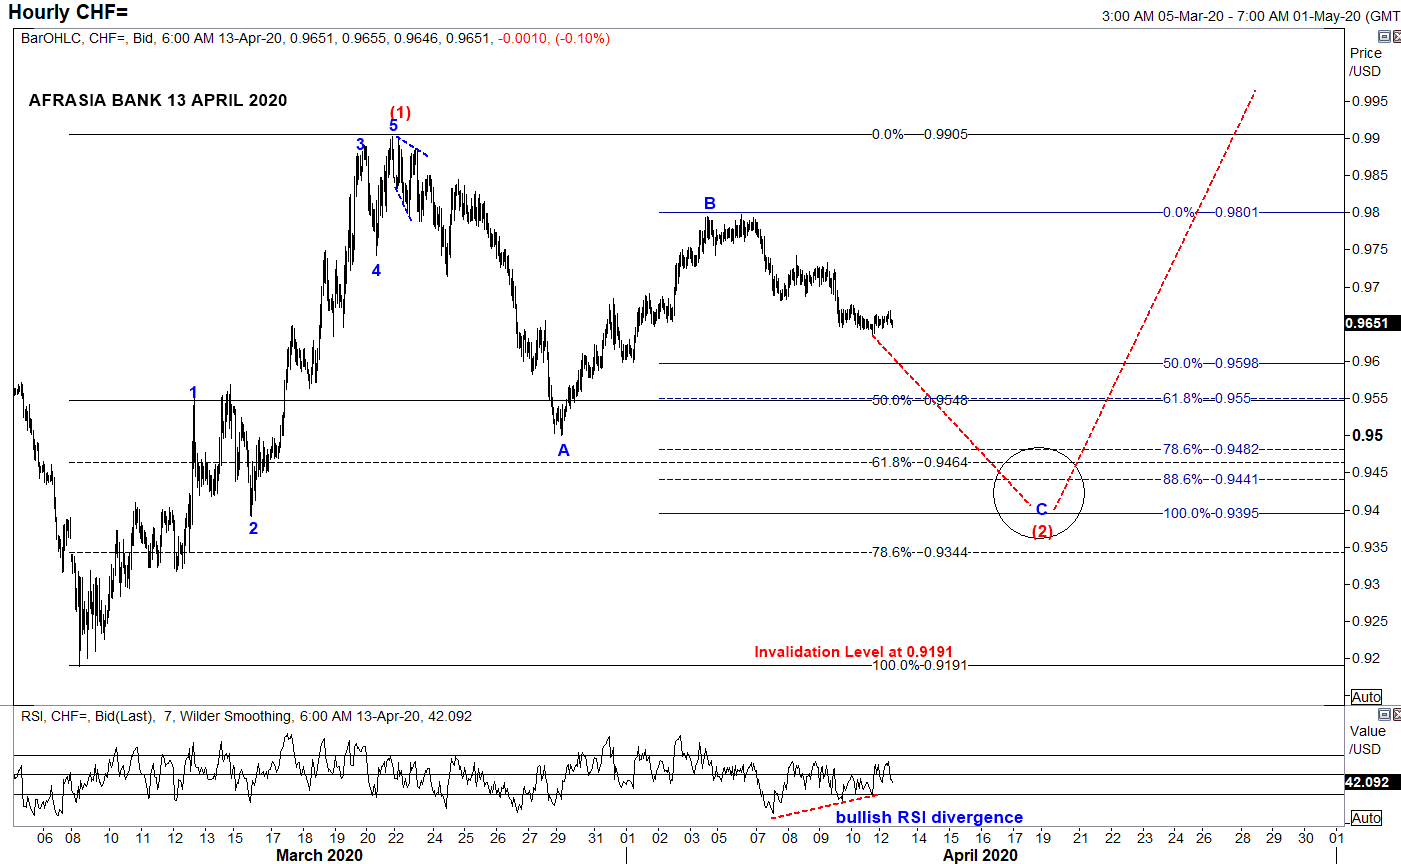
  • From an Elliott Wave standpoint, USDCHF could potentially unfold into compelling impulsive Wave C of the zigzag correction of Wave (2) to a narrowing region 0.9550 (50% retracement of Wave (1)) to 0.9395 (100% projection of Wave A through B) in the near term trend, from the downside bias from April 6th high of 0.9797.
  • Price could immediately start to shoot back up into Wave (3) on a longer perspective.
  • Piercing above the resistance 0.9905 would endorse the structure.
  • Alternatively, broader bearish invalidation of Elliott Wave Structure rest at 0.9191 of March 9th low while Relative Strength Index signals a bullish recoil higher for the pair.
Japanese Yen rebound may fizzle its way back to Safe-haven status
Chart posted on 14.04.2020

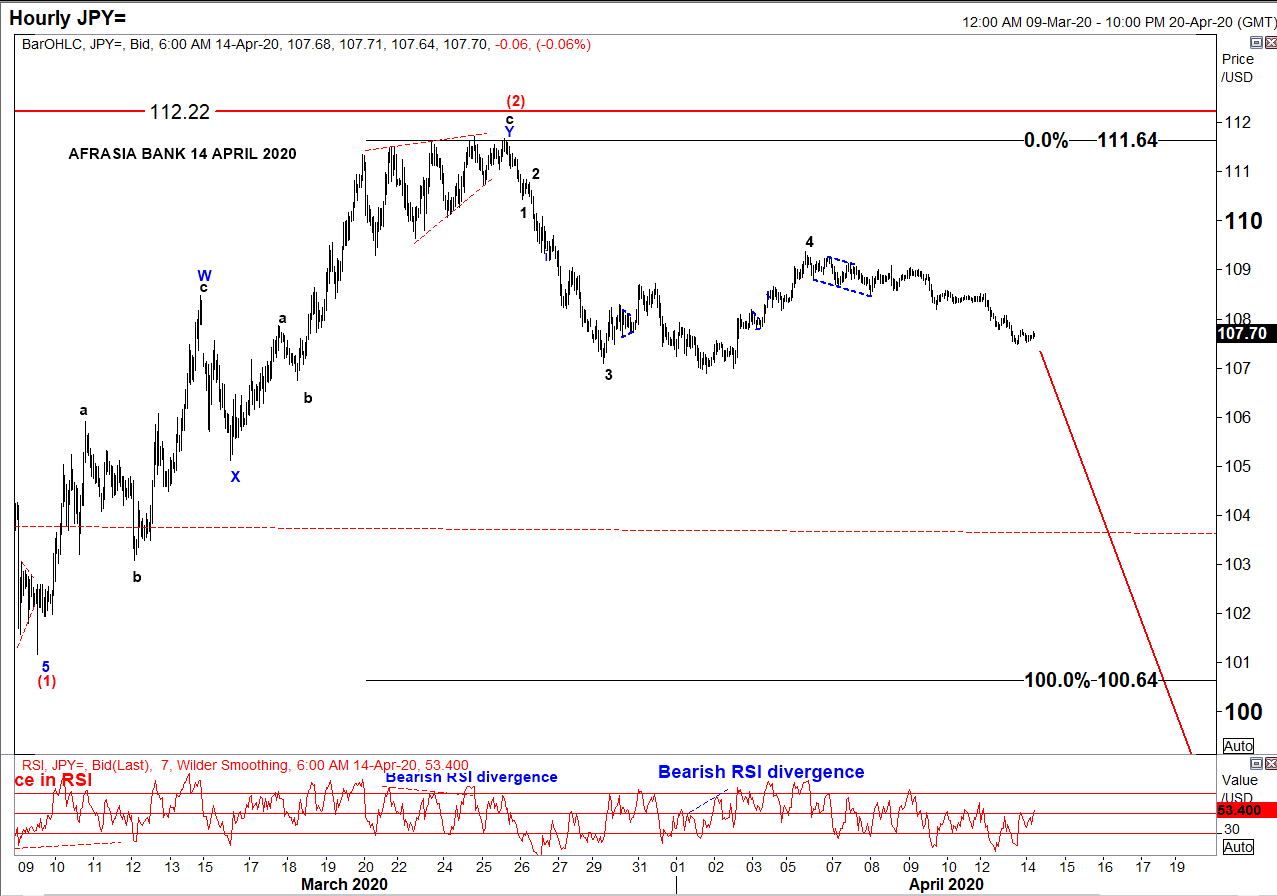
• After rallying to the downside from a high of 112.22 to 101.17 amid global pandemic threat, USD/JPY has been in a correcting mode since 9th March 2020 and seemed to have recently completed an W-X-Y Double Zig-Zag structure of Wave (2) reaching a high of 111.64 on 27th March 2020.
• Two strong indicators were flashing a trend reversal: ending diagonal at Wave 5 of Wave c and bearish RSI divergence.
• On the hourly chart, as per Elliott Wave analysis, the pair might resume its downwards trend targeting 100.64 - 93.78 to unfold Wave (3), a projection of 100%-161.8% of Fibonacci level.
• At 107.70 today, USD/JPY is percolating towards its target from 110.41 to 107.84, as per chart.
• On a side note, resumption of a bullish USD/JPY would mark an invalidation of the Elliott Wave structure above 112.22

Markey update on Biz Week by Christie Ng
Speak to our team
  • Allan Juste
    Head - Forex And Derivatives
    +230 5251 4855
  • Reshma Peerun Rajwani
    Head – Treasury Sales
    +230 403 5500
Disclaimer
Please note that the information published is purely indicative. It is based on technical data from sources which the Bank verily believes to be authentic, though its timeliness or accuracy cannot be warranted or guaranteed. AfrAsia Bank Ltd issues no invitation to anyone to rely on this bulletin and neither we nor our information providers shall be in no way whatsoever, liable for any errors or inaccuracies, regardless of cause, or the lack of timeliness, or for any delay or interruption in the transmission thereof to the user. The indicative rates and other market information are subject to changes at the Bank's discretion. Whilst every effort is made to ensure the information is accurate, you should confirm the latest situation with the Bank prior to making any decisions.