
Your net worth to the world is usually determined by what remains after your bad habits are subtracted from your good ones.
USD
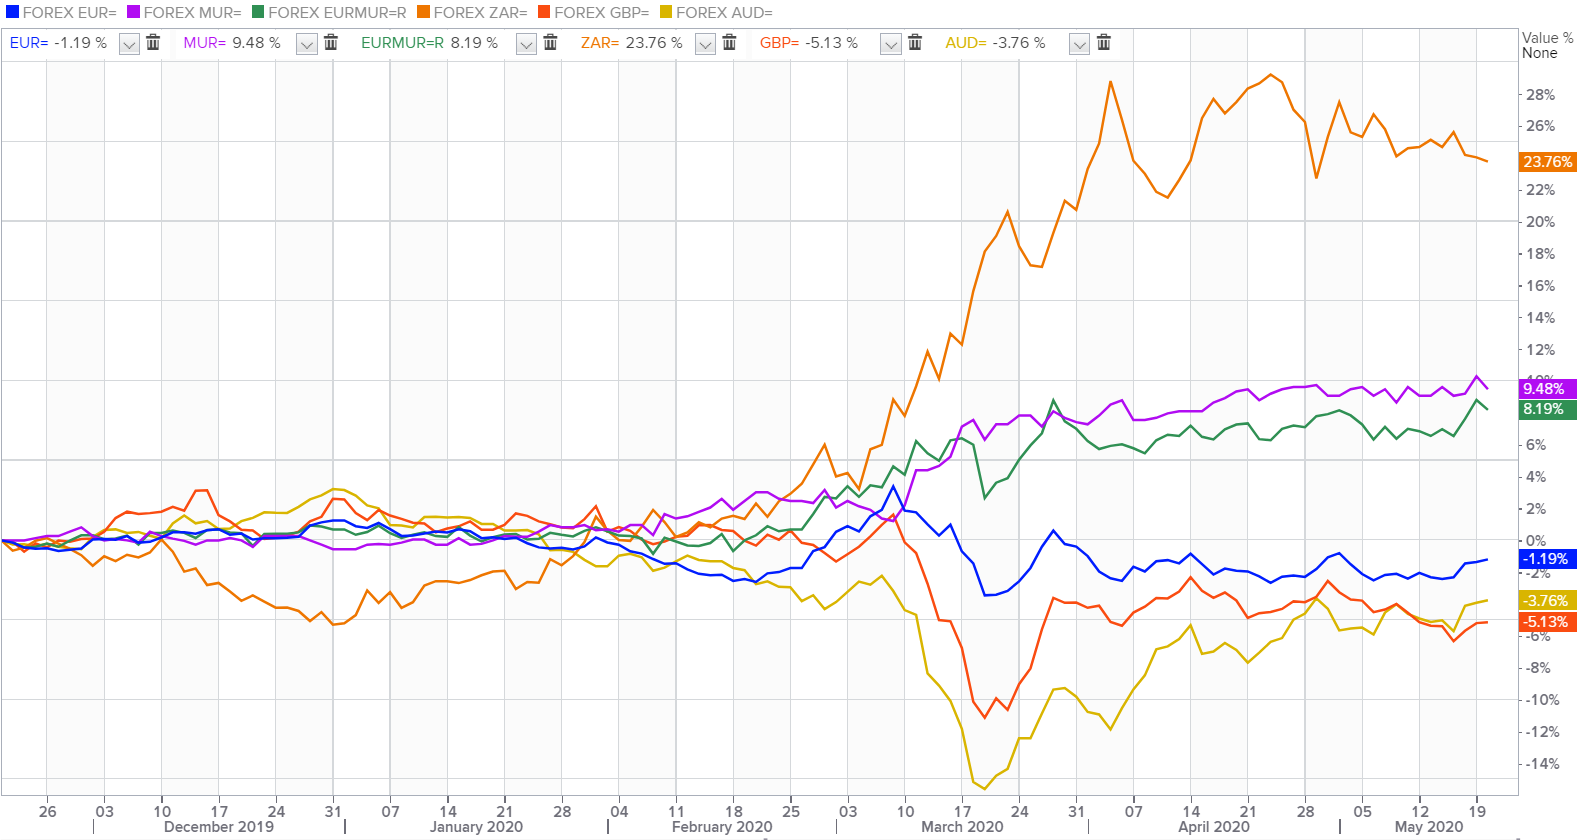
EUR/USD
The Single currency kept the bullish tone at $1.0950 ahead of ECB’s President Christine Lagarde's speech at 11:30, while the European Union is likely to unveil its own recovery fund linked to the EU's next long-term budget today to help the bloc recover from the coronavirus-fuelled economic slump.
GBP/USD
The Pound soared to a high of $1.2360 on Tuesday, before retreating to $1.2315, following news that the European Union’s Brexit negotiator Michel Barnier was said to drop demand of unchanged access to the fishing grounds around the UK’s coast.
USD/JPY
The Japanese yen surged to 107.50 against the greenback on news that Japan will compile a new JPY117.1 trillion stimulus package that includes significant direct spending.
AUD/USD
The Australian Dollar eased slightly to $0.6640 after strong gains the previous day, on report Trump administration was weighing a range of sanctions on Chinese officials.
USD/ZAR
The Rand hit an eight week high at 17.34 per dollar on rising hope of economic recovery in a number of countries.
USD/MUR
On the domestic market, the USD/MUR jostled near 40.45(selling).
11:30 - EUR - ECB President Lagarde Speaks

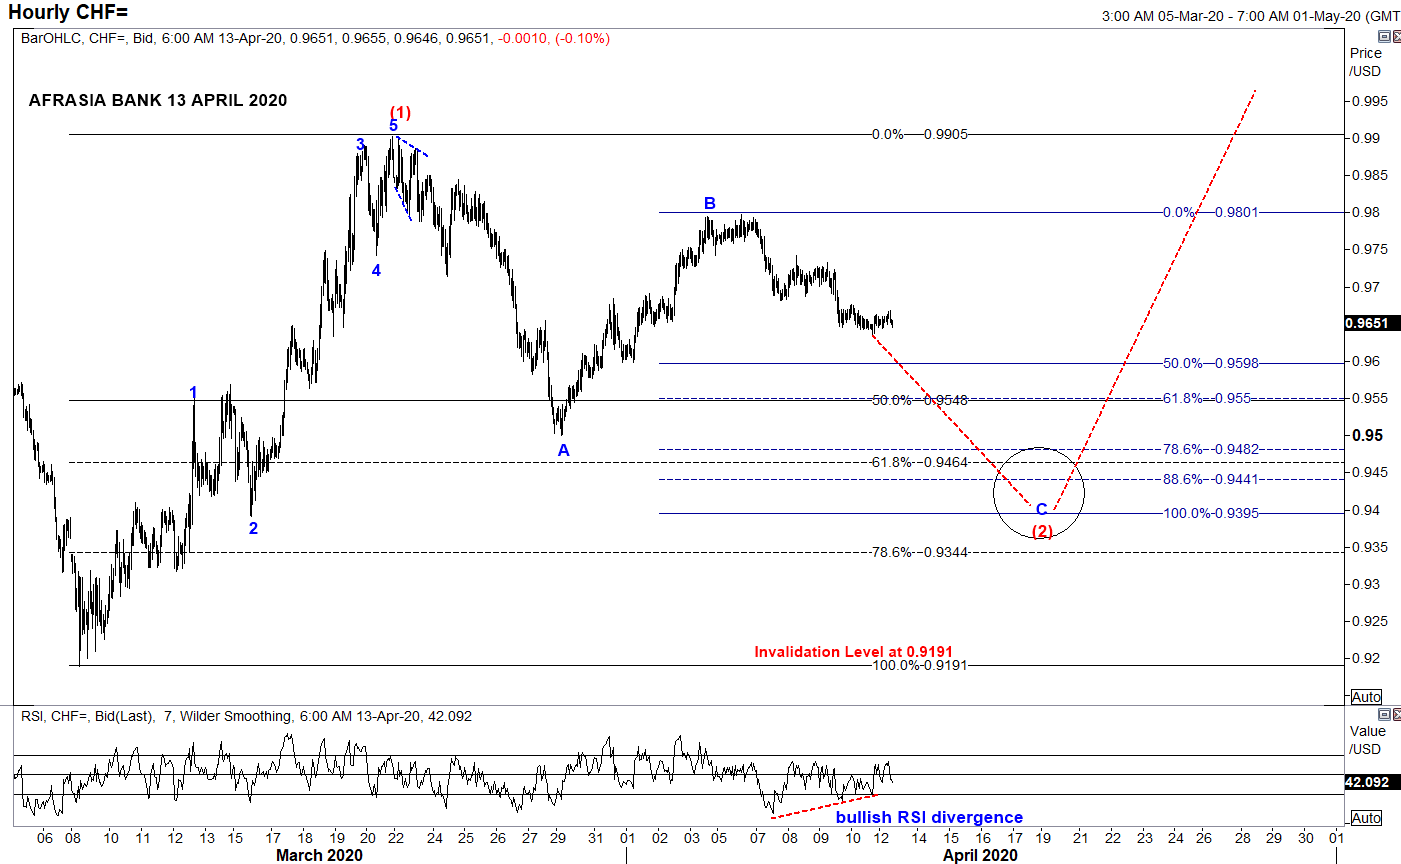
- From an Elliott Wave standpoint, USDCHF could potentially unfold into compelling impulsive Wave C of the zigzag correction of Wave (2) to a narrowing region 0.9550 (50% retracement of Wave (1)) to 0.9395 (100% projection of Wave A through B) in the near term trend, from the downside bias from April 6th high of 0.9797.
- Price could immediately start to shoot back up into Wave (3) on a longer perspective.
- Piercing above the resistance 0.9905 would endorse the structure.
- Alternatively, broader bearish invalidation of Elliott Wave Structure rest at 0.9191 of March 9th low while Relative Strength Index signals a bullish recoil higher for the pair.
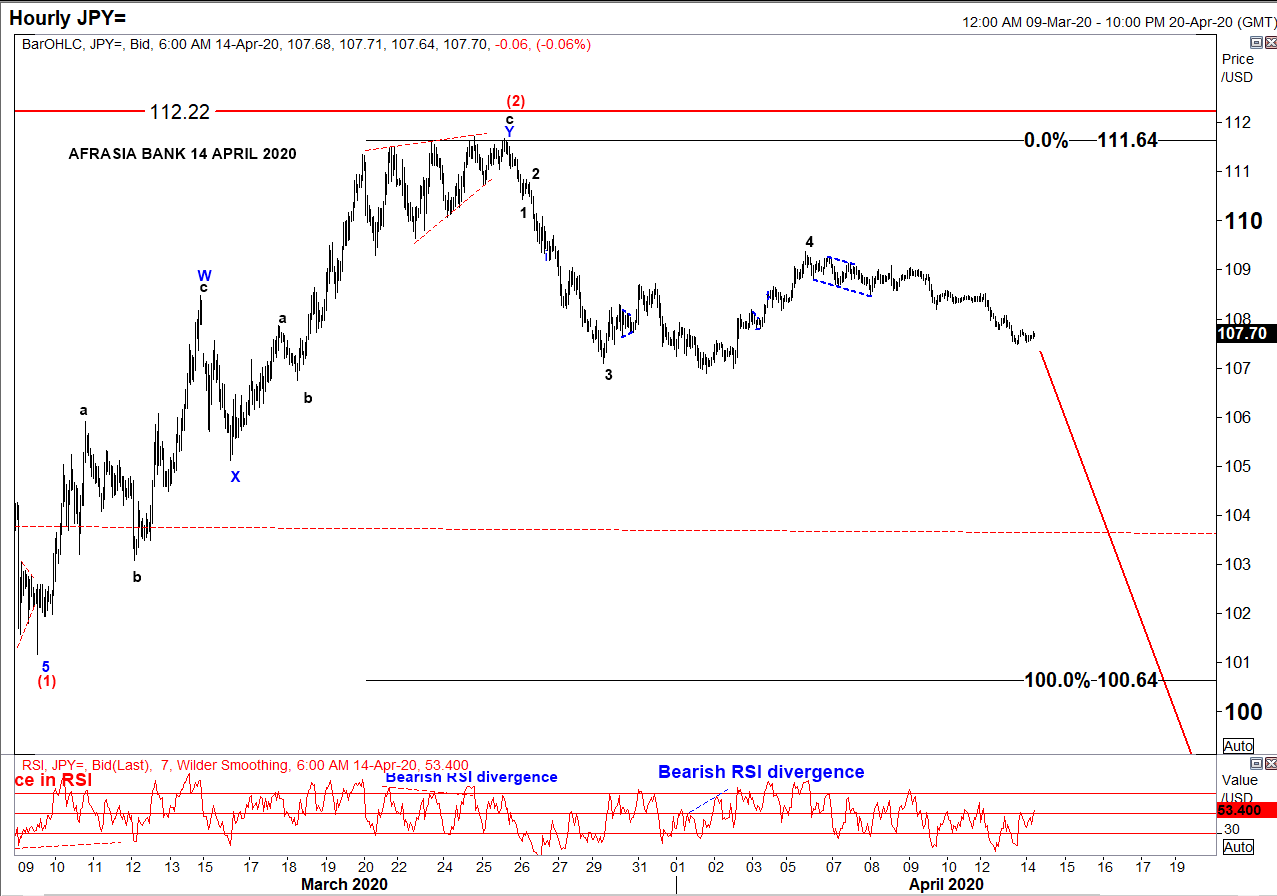
• After rallying to the downside from a high of 112.22 to 101.17 amid global pandemic threat, USD/JPY has been in a correcting mode since 9th March 2020 and seemed to have recently completed an W-X-Y Double Zig-Zag structure of Wave (2) reaching a high of 111.64 on 27th March 2020.
• Two strong indicators were flashing a trend reversal: ending diagonal at Wave 5 of Wave c and bearish RSI divergence.
• On the hourly chart, as per Elliott Wave analysis, the pair might resume its downwards trend targeting 100.64 - 93.78 to unfold Wave (3), a projection of 100%-161.8% of Fibonacci level.
• At 107.70 today, USD/JPY is percolating towards its target from 110.41 to 107.84, as per chart.
• On a side note, resumption of a bullish USD/JPY would mark an invalidation of the Elliott Wave structure above 112.22