Internet Banking
Click icon again to close

Treasury

Daily Market Patrol

Market Patrol 26 May 2020

In the end, it matters less that you can fight. What you fight for is the real test. 
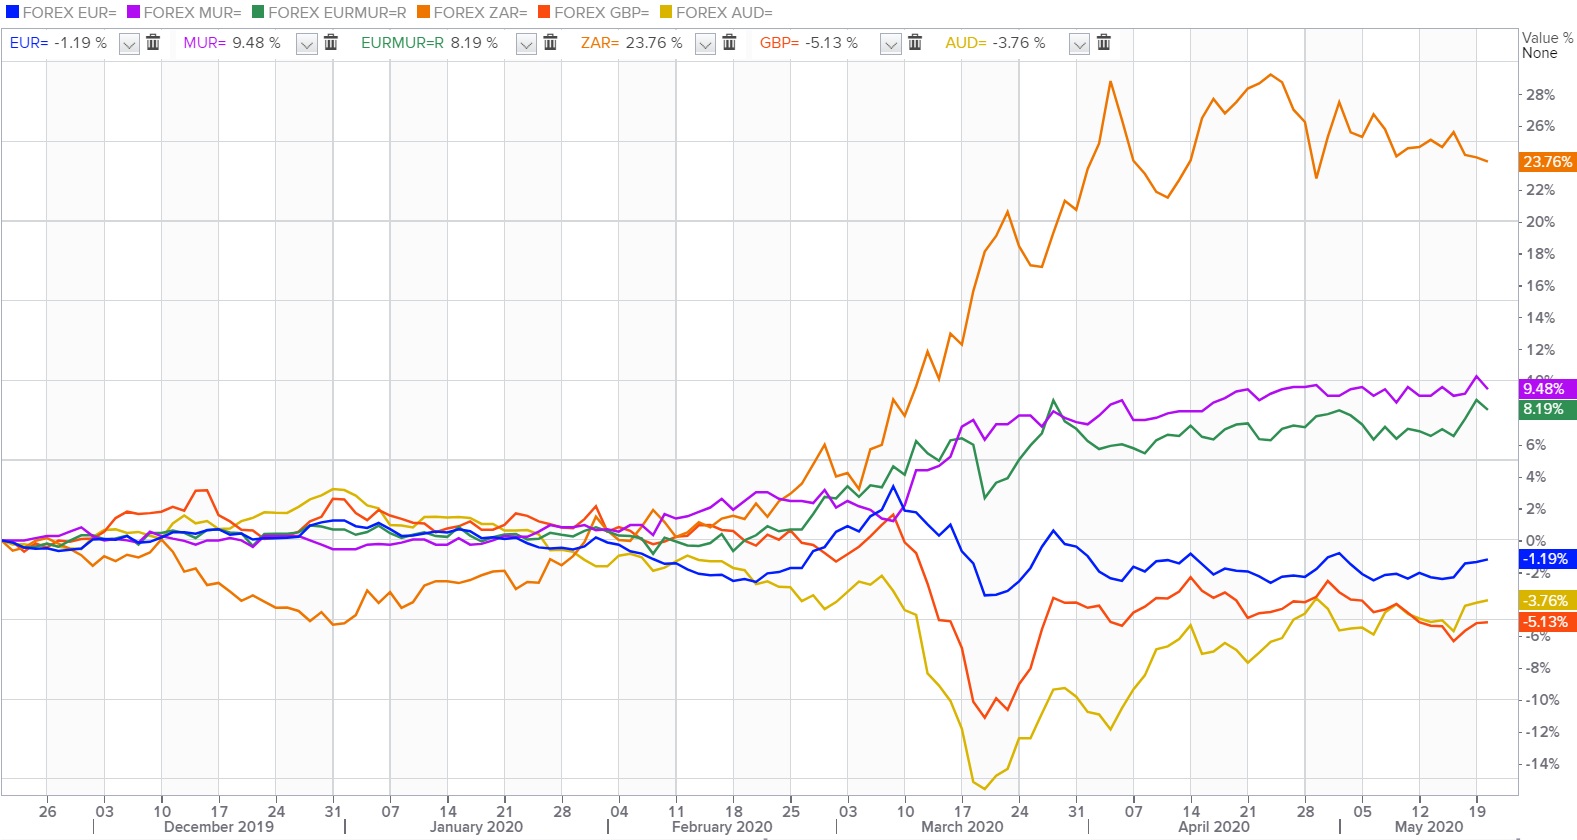
John Maccain
Indicative Selling Rates
against MUR
USD
24 Apr 2024
  • AUD
  • 30.84
  • 0.6580
  • BWP
  • 3.43
  • 0.0732
  • CAD
  • 34.58
  • 1.3552
  • CNY
  • 6.56
  • 7.1461
  • DKK
  • 6.83
  • 6.8651
  • EUR
  • 50.42
  • 1.0758
  • HKD
  • 6.07
  • 7.7178
  • INR
  • 0.57
  • 81.9769
  • JPY
  • 30.62
  • 153.0506
  • KES
  • 35.48
  • 132.1115
  • NZD
  • 28.11
  • 0.5997
  • NOK
  • 4.40
  • 10.6625
  • SGD
  • 34.83
  • 1.3457
  • ZAR
  • 2.54
  • 18.4847
  • SEK
  • 4.40
  • 10.6565
  • CHF
  • 51.73
  • 1.1037
  • GBP
  • 58.66
  • 1.2515
  • USD
  • 46.87
  • 1.0000
  • AED
  • 12.96
  • 3.6156
The greenback pared initial gains made on Monday as a rise in risk appetite weighed heavily on the USD, with investors looking past Sino-U.S trade tensions to more stimulus in China and re-opening world economy.
Fundamental News

EUR/USD
The Single currency took the bid to $1.0919 on Tuesday, finding support in a better than expected German IFO survey the previous day, which showed that the business climate began improving.


GBP/USD 
The Pound climbed from a low of $1.2163 to $1.2220, taking advantage of a softer U.S dollar and slight risk-on tones.


USD/JPY
The Japanese yen fetched 107.83 per dollar after Bank of Japan’s Kuroda warned about downside risks to Japan’s economy


AUD/USD
Aussie tensed up to $0.6570 despite Australia-China relations deteriorate. Beijing is reportedly considering targeting more Australian exports including dairy, wine, seafood and fruit, and also stricter quality checks and custom delays for Chinese tourists and students.


USD/ZAR
The Rand was a shade firmer at $17.56 as continued optimism over the reopening of economies from Europe to Japan remained supportive of risk appetite.


USD/MUR
The USD/MUR opened flat at 40.45(selling) on domestic FX market.

Fundamental & Technical Data
Economic Indicators-Local Time

18:00 - USD - CB Consumer Confidence (May)

18:00 - USD - New Home Sales (Apr)


Central Bank Interest Rates
Last Change
New Meeting
Federal Bank of U.S
0.00-0.25%
16-Mar-2020
10-Jun-2020
European Central Bank
0.00%
10-Mar-2016
04-Jun-2020
Bank of England
0.10%
19-May-2020
18-Jun-2020
Bank of Japan
-0.10%
28-Jan-2016
16-Jun-2020
Reserve Bank of Australia
0.25%
18-Mar-2020
02-Jun-2020
S.Africa Reserve Bank
4.25%
21-May-2020
-
Reserve Bank of India
4.00%
22-May-2020
-
Bank of Mauritius
1.85%
16-Apr-2020
-
Looking for Markets correlation?
Market Correlation is a measure, statistical or observational, that gives a positive or negative link between the pricing of multiple currencies.

Bulls & Bears Levels
Resistance and Support
Levels
EUR/USD
GBP/USD
USD/JPY
USD/ZAR
R3
1.0961
1.2247
108.02
18.40
R2
1.0938
1.2225
107.90
17.81
R1
1.0917
1.2208
107.80
17.99
PP
1.0894
1.2186
107.69
17.50
S1
1.0873
1.2168
107.59
17.23
S2
1.0850
1.2146
107.48
16.58
S3
1.0830
1.2129
107.38
15.92
Technical Analysis - Forex Charts
Safe-haven nature of FRANC SWISS may plummet USD/CHF to a downfall
Chart updated on 13.04.2020
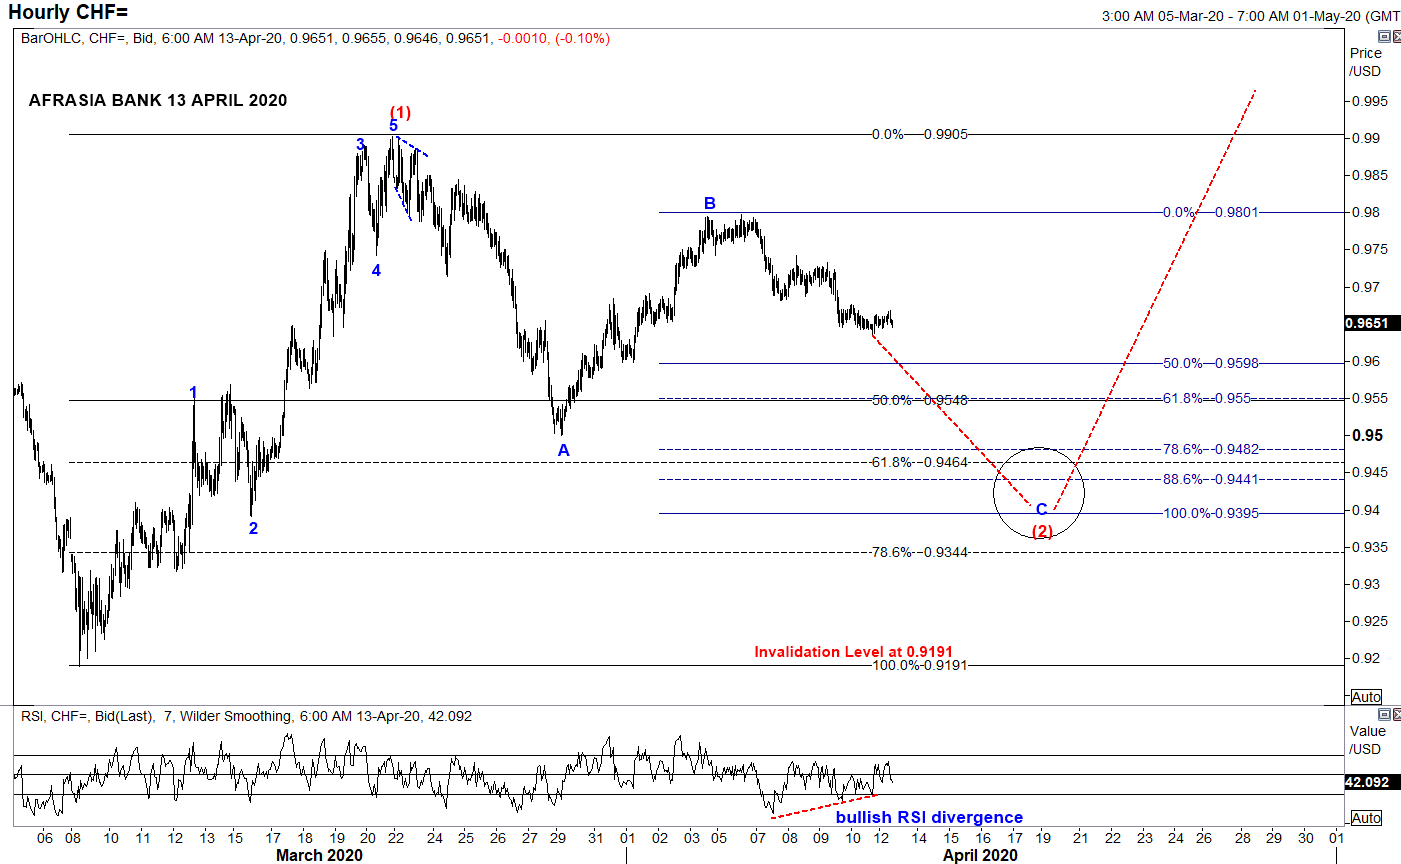
  • From an Elliott Wave standpoint, USDCHF could potentially unfold into compelling impulsive Wave C of the zigzag correction of Wave (2) to a narrowing region 0.9550 (50% retracement of Wave (1)) to 0.9395 (100% projection of Wave A through B) in the near term trend, from the downside bias from April 6th high of 0.9797.
  • Price could immediately start to shoot back up into Wave (3) on a longer perspective.
  • Piercing above the resistance 0.9905 would endorse the structure.
  • Alternatively, broader bearish invalidation of Elliott Wave Structure rest at 0.9191 of March 9th low while Relative Strength Index signals a bullish recoil higher for the pair.
Japanese Yen rebound may fizzle its way back to Safe-haven status
Chart posted on 14.04.2020

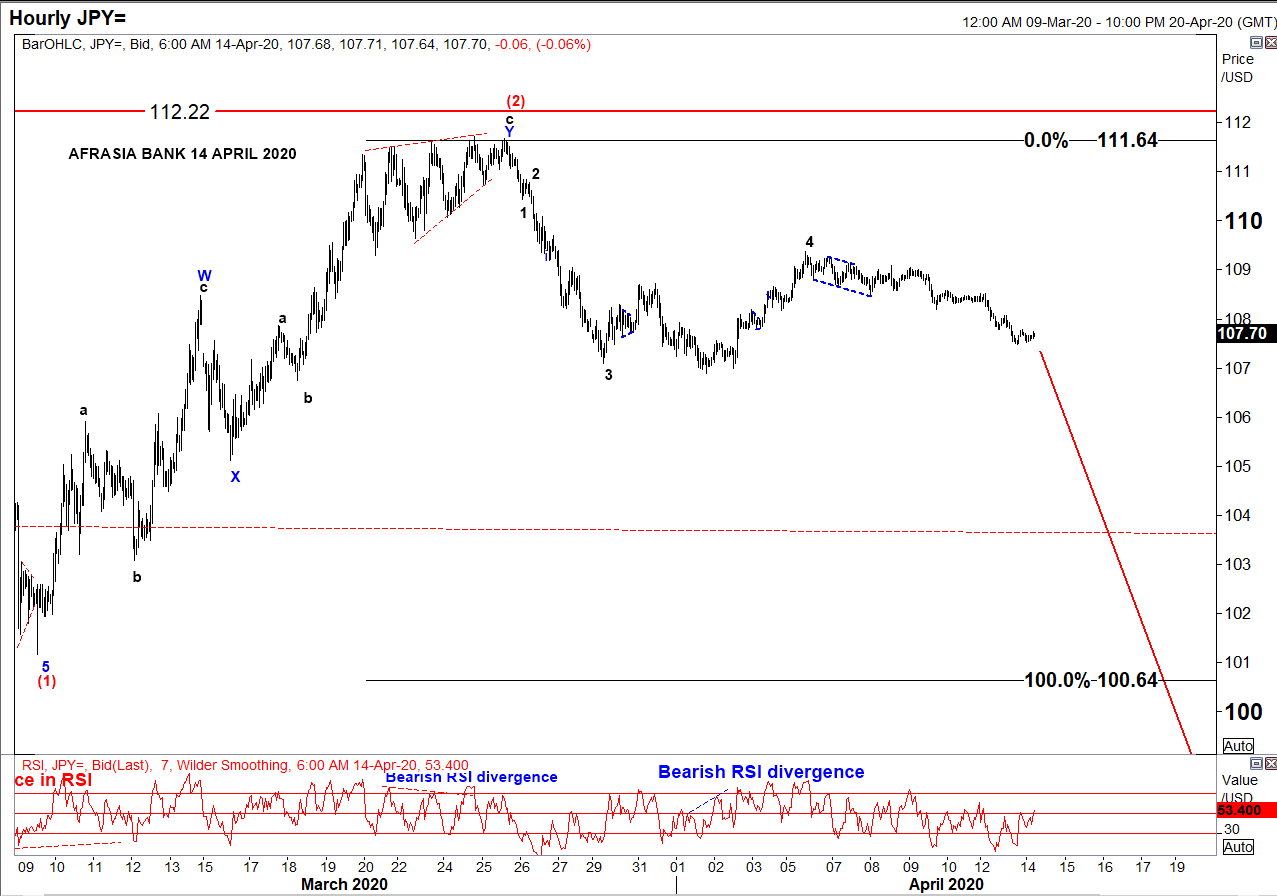
• After rallying to the downside from a high of 112.22 to 101.17 amid global pandemic threat, USD/JPY has been in a correcting mode since 9th March 2020 and seemed to have recently completed an W-X-Y Double Zig-Zag structure of Wave (2) reaching a high of 111.64 on 27th March 2020.
• Two strong indicators were flashing a trend reversal: ending diagonal at Wave 5 of Wave c and bearish RSI divergence.
• On the hourly chart, as per Elliott Wave analysis, the pair might resume its downwards trend targeting 100.64 - 93.78 to unfold Wave (3), a projection of 100%-161.8% of Fibonacci level.
• At 107.70 today, USD/JPY is percolating towards its target from 110.41 to 107.84, as per chart.
• On a side note, resumption of a bullish USD/JPY would mark an invalidation of the Elliott Wave structure above 112.22

Markey update on Biz Week by Christie Ng
Speak to our team
  • Allan Juste
    Head - Forex And Derivatives
    +230 5251 4855
  • Reshma Peerun Rajwani
    Head – Treasury Sales
    +230 403 5500
Disclaimer
Please note that the information published is purely indicative. It is based on technical data from sources which the Bank verily believes to be authentic, though its timeliness or accuracy cannot be warranted or guaranteed. AfrAsia Bank Ltd issues no invitation to anyone to rely on this bulletin and neither we nor our information providers shall be in no way whatsoever, liable for any errors or inaccuracies, regardless of cause, or the lack of timeliness, or for any delay or interruption in the transmission thereof to the user. The indicative rates and other market information are subject to changes at the Bank's discretion. Whilst every effort is made to ensure the information is accurate, you should confirm the latest situation with the Bank prior to making any decisions.