Internet Banking
Click icon again to close

Treasury

Daily Market Patrol

Market Patrol 13 May 2020

There is a time to go long, a time to go short and a time to go fishing.

Jesse Livermore
Indicative Selling Rates
against MUR
USD
25 Apr 2024
  • AUD
  • 30.77
  • 0.6565
  • BWP
  • 3.43
  • 0.0733
  • CAD
  • 34.51
  • 1.3581
  • CNY
  • 6.56
  • 7.1473
  • DKK
  • 6.83
  • 6.8649
  • EUR
  • 50.42
  • 1.0758
  • HKD
  • 6.08
  • 7.7125
  • INR
  • 0.57
  • 82.0612
  • JPY
  • 30.50
  • 153.6760
  • KES
  • 35.48
  • 132.1115
  • NZD
  • 28.10
  • 0.5994
  • NOK
  • 4.36
  • 10.7536
  • SGD
  • 34.80
  • 1.3468
  • ZAR
  • 2.52
  • 18.6007
  • SEK
  • 4.37
  • 10.7251
  • CHF
  • 51.57
  • 1.1003
  • GBP
  • 58.71
  • 1.2526
  • USD
  • 46.87
  • 1.0000
  • AED
  • 12.96
  • 3.6157
U.S. Dollar on defensive as negative rates debate puts focus on U.S Fed Chair Powell speech
Fundamental News

EUR/USD
The single currency managed to hold gains near $1.0850 after worse than expected US inflation figures, the lowest reading since 2015, and ahead of Powell speech at 17:00 amid rising speculation the United States could adopt negative interest rates.


GBP/USD
The cable plummeted to $1.2270 this morning as persistent confusion over government plans to ease lockdown measures, the worse COVID-19 death toll in Europe, and revived Brexit risks all weighed on the pound. Market awaiting today’s slew of UK economic releases including GDP figures.


USD/JPY
The yen extended gains to 107.20 versus the U.S dollar as the US-China trade war and virus outbreak fears loom.


AUD/USD
After recovering to a high of $0.6530 yesterday, the Aussie fell again to $0.6470 today as the trade war with China joins hands with the broad risk-off sentiment.


USD/ZAR
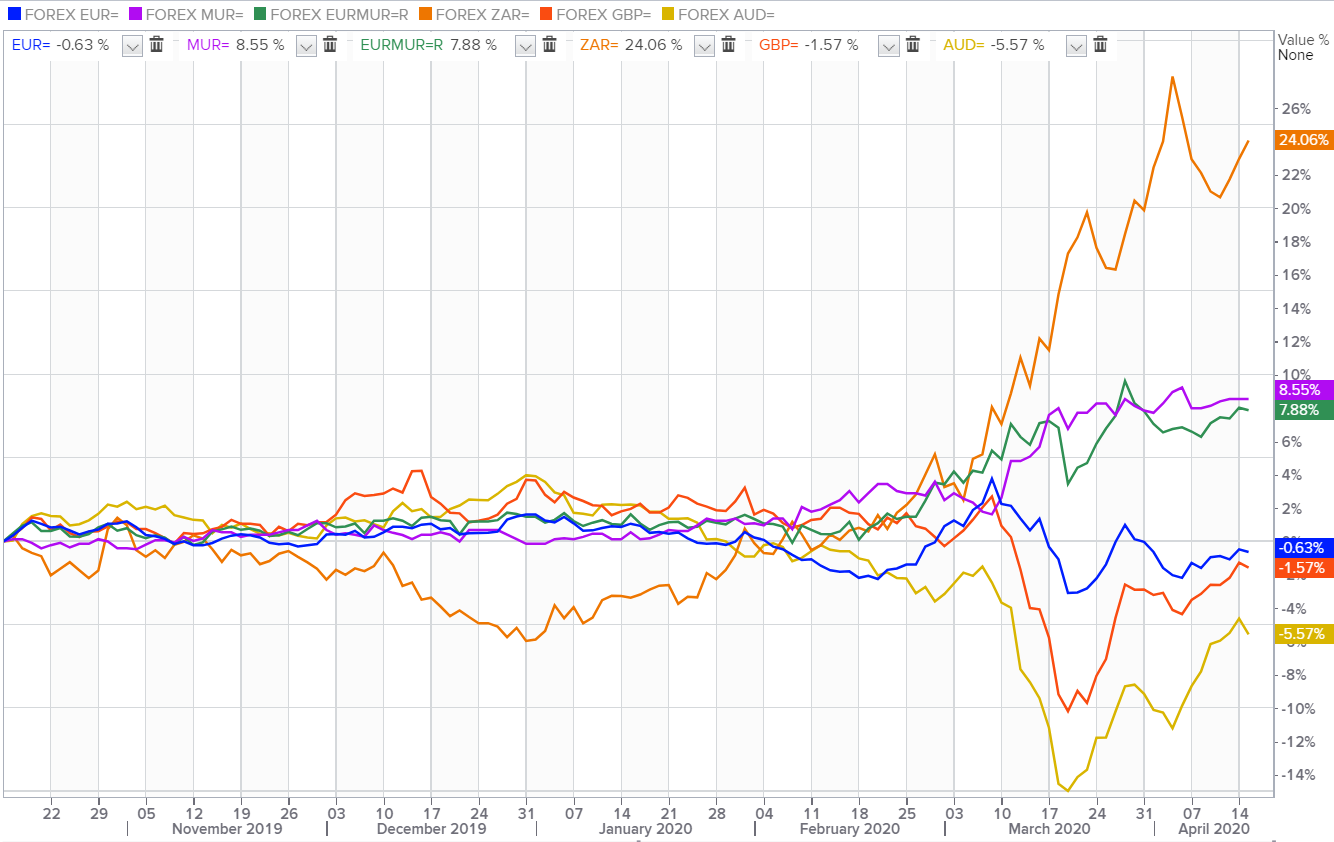
The South African rand firmed at 18.36 per dollar on Tuesday as demand for emerging markets was boosted after China waived tariffs on certain U.S. imports yesterday.


USD/MUR
On the local market, the USD/MUR clawed back gains to 40.30(selling) this morning undermined by Bank of Mauritius’s intervention for three weeks in a row.

Fundamental & Technical Data
Economic Indicators-Local Time

10:00 - GBP - GDP (QoQ)(Q1), GDP (YoY)(Q1)

10:00 - GBP - Manufacturing Production (MoM)(Mar)

10:00 - GBP - Monthly GDP 3M/3M Change

16:30 - USD - Crude Oil Inventories

Central Bank Interest Rates
Last Change
New Meeting
Federal Bank of U.S
0.00-0.25%
16-Mar-2020
10-Jun-2020
European Central Bank
0.00%
10-Mar-2016
04-Jun-2020
Bank of England
0.10%
19-May-2020
18-Jun-2020
Bank of Japan
-0.10%
28-Jan-2016
16-Jun-2020
Reserve Bank of Australia
0.25%
18-Mar-2020
02-Jun-2020
S.Africa Reserve Bank
4.25%
14-Apr-2020
21-May-2020
Reserve Bank of India
4.40%
27-Mar-2020
03-May-2020
Bank of Mauritius
1.85%
16-Apr-2020
-
Looking for Markets correlation?
Market Correlation is a measure, statistical or observational, that gives a positive or negative link between the pricing of multiple currencies.

Bulls & Bears Levels
Resistance and Support
Levels
EUR/USD
GBP/USD
USD/JPY
USD/ZAR
R3
1.0994
1.2462
108.09
19.54
R2
1.0940
1.2420
107.89
19.34
R1
1.0894
1.2298
107.52
19.17
PP
1.0839
1.2298
107.32
18.76
S1
1.0793
1.2218
106.94
18.58
S2
1.0738
1.2176
106.75
17.99
S3
1.0692
1.2096
106.37
17.81
Technical Analysis - Forex Charts
Safe-haven nature of FRANC SWISS may plummet USD/CHF to a downfall
Chart updated on 13.04.2020
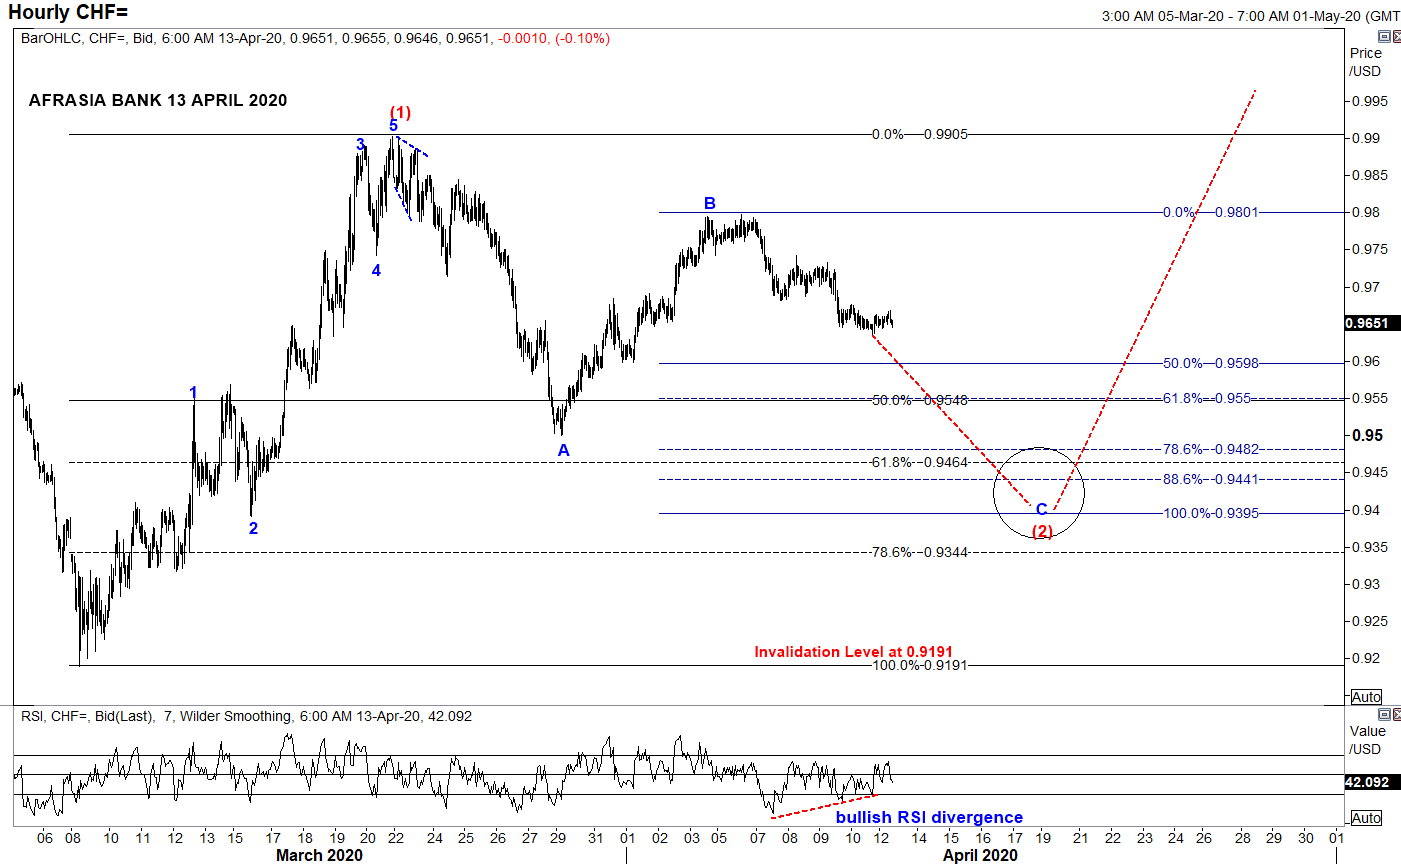
  • From an Elliott Wave standpoint, USDCHF could potentially unfold into compelling impulsive Wave C of the zigzag correction of Wave (2) to a narrowing region 0.9550 (50% retracement of Wave (1)) to 0.9395 (100% projection of Wave A through B) in the near term trend, from the downside bias from April 6th high of 0.9797.
  • Price could immediately start to shoot back up into Wave (3) on a longer perspective.
  • Piercing above the resistance 0.9905 would endorse the structure.
  • Alternatively, broader bearish invalidation of Elliott Wave Structure rest at 0.9191 of March 9th low while Relative Strength Index signals a bullish recoil higher for the pair.
Japanese Yen rebound may fizzle its way back to Safe-haven status
Chart posted on 14.04.2020

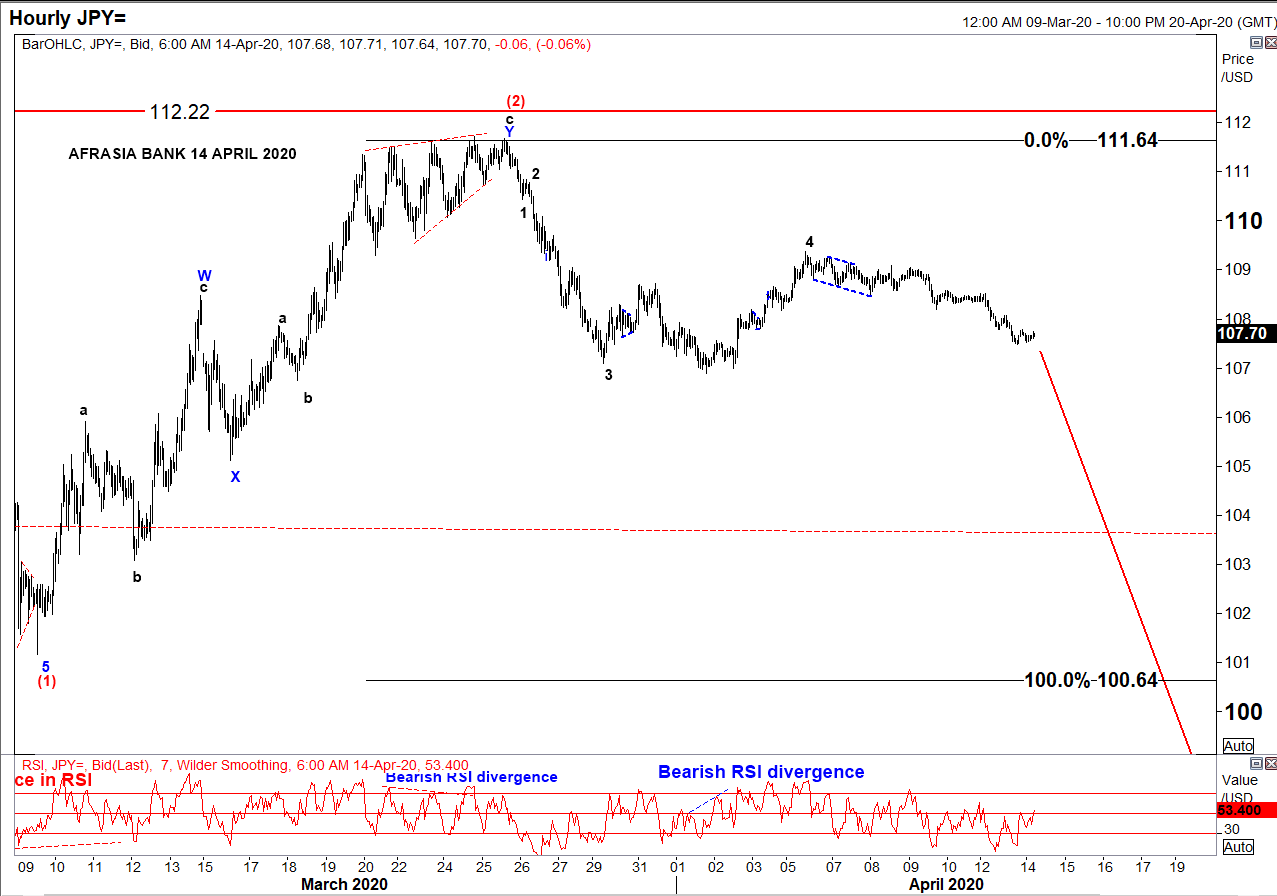
• After rallying to the downside from a high of 112.22 to 101.17 amid global pandemic threat, USD/JPY has been in a correcting mode since 9th March 2020 and seemed to have recently completed an W-X-Y Double Zig-Zag structure of Wave (2) reaching a high of 111.64 on 27th March 2020.
• Two strong indicators were flashing a trend reversal: ending diagonal at Wave 5 of Wave c and bearish RSI divergence.
• On the hourly chart, as per Elliott Wave analysis, the pair might resume its downwards trend targeting 100.64 - 93.78 to unfold Wave (3), a projection of 100%-161.8% of Fibonacci level.
• At 107.70 today, USD/JPY is percolating towards its target from 110.41 to 107.84, as per chart.
• On a side note, resumption of a bullish USD/JPY would mark an invalidation of the Elliott Wave structure above 112.22

Markey update on Biz Week by Christie Ng
Speak to our team
  • Allan Juste
    Head - Forex And Derivatives
    +230 5251 4855
  • Reshma Peerun Rajwani
    Head – Treasury Sales
    +230 403 5500
Disclaimer
Please note that the information published is purely indicative. It is based on technical data from sources which the Bank verily believes to be authentic, though its timeliness or accuracy cannot be warranted or guaranteed. AfrAsia Bank Ltd issues no invitation to anyone to rely on this bulletin and neither we nor our information providers shall be in no way whatsoever, liable for any errors or inaccuracies, regardless of cause, or the lack of timeliness, or for any delay or interruption in the transmission thereof to the user. The indicative rates and other market information are subject to changes at the Bank's discretion. Whilst every effort is made to ensure the information is accurate, you should confirm the latest situation with the Bank prior to making any decisions.