Internet Banking
Click icon again to close

Treasury

Daily Market Patrol

Market Patrol 14 May 2020

If you personalize losses, you can’t trade. 
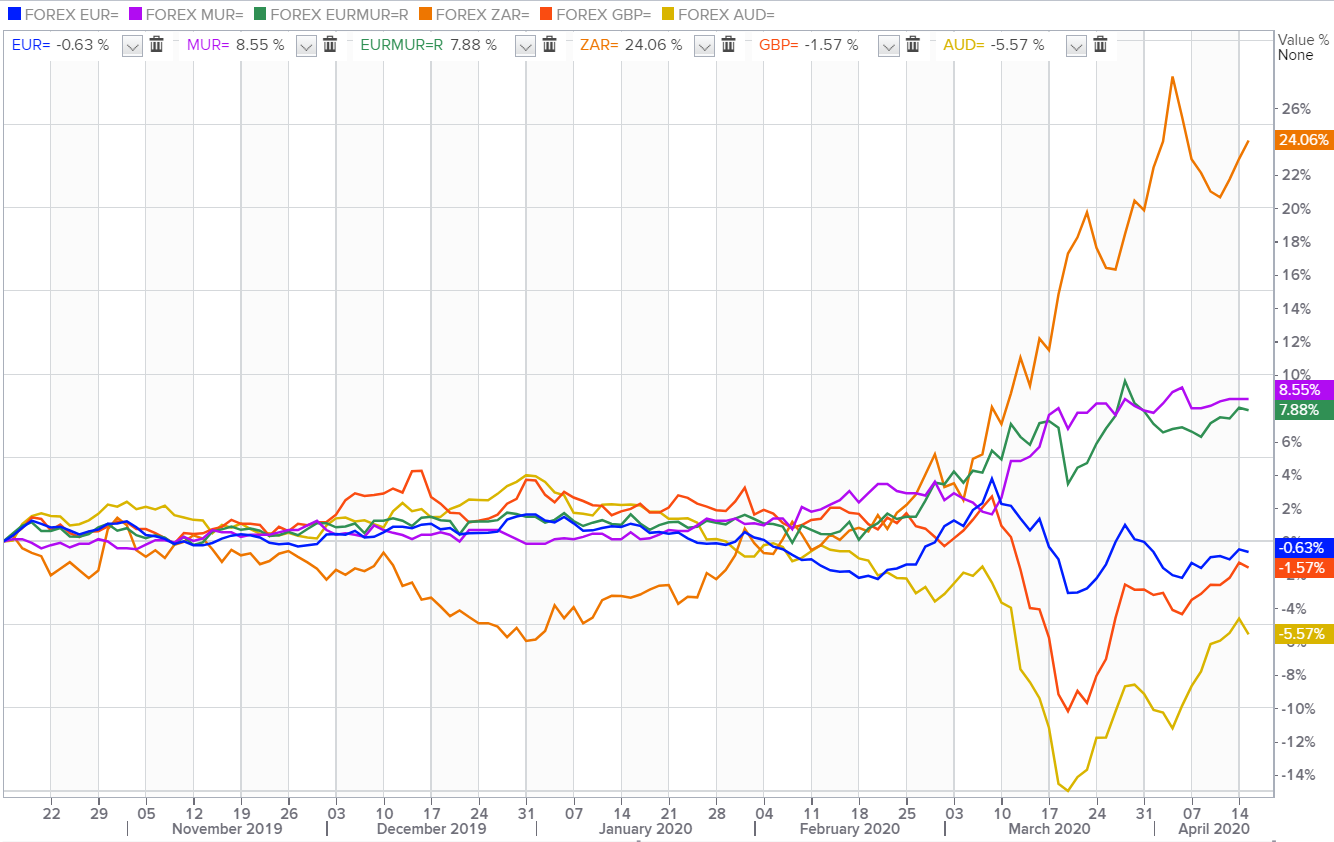
Bruce Kovner
Indicative Selling Rates
against MUR
USD
18 Apr 2024
  • AUD
  • 30.55
  • 0.6504
  • BWP
  • 3.46
  • 0.0738
  • CAD
  • 34.43
  • 1.3642
  • CNY
  • 6.58
  • 7.1369
  • DKK
  • 6.82
  • 6.8835
  • EUR
  • 50.41
  • 1.0732
  • HKD
  • 6.09
  • 7.7142
  • INR
  • 0.57
  • 82.2069
  • JPY
  • 30.79
  • 152.5363
  • KES
  • 36.08
  • 130.1709
  • NZD
  • 28.05
  • 0.5972
  • NOK
  • 4.37
  • 10.7550
  • SGD
  • 34.90
  • 1.3459
  • ZAR
  • 2.55
  • 18.3894
  • SEK
  • 4.36
  • 10.7728
  • CHF
  • 51.95
  • 1.1061
  • GBP
  • 58.86
  • 1.2531
  • USD
  • 46.97
  • 1.0000
  • AED
  • 12.99
  • 3.6158
U.S Dollar holds advantage as President Fed Powell quashes negative rates.
Fundamental News

EUR/USD
The rally on the Single currency has been capped at $1.0896 yesterday after U.S. Federal Reserve Chairman Jerome Powell dismissed speculation that policymakers will adopt negative interest rates, but has warned about a sustained economic downturn caused by the pandemic.


GBP/USD
The cable extended losses for the fourth consecutive day below $1.22 as downbeat performance of the UK data, while Rishi Sunak extended the furlough scheme and BoE Governor Andrew Bailey opened the door to further bond-buying.


USD/JPY
The yen remained bid at 106.90 versus the U.S dollar, amid broad risk-off sentiment, as US-China tension intensified after Trump ordered a Federal retirement savings fund to delay diversifying into Chinese stocks.


AUD/USD
The Aussie on the back foot below $0.6435 after Australia’s monthly employment data for April showed jobs dived by a record 594,300 and the unemployment rate shot up to 6.2, falling sharply to 63.5%.


USD/ZAR
The South African rand edged lower to 18.58 per dollar as pessimism surrounding the US-China tussle weighed on the market’s risk-tone.


USD/MUR
The USD/MUR surged by 15 cents to 40.45(selling) this morning on broad U.S dollar strength.

Fundamental & Technical Data
Economic Indicators-Local Time

16:30 - USD - Initial Jobless Claims

19:15 - CAD - BoC Gov Poloz Speaks

Central Bank Interest Rates
Last Change
New Meeting
Federal Bank of U.S
0.00-0.25%
16-Mar-2020
10-Jun-2020
European Central Bank
0.00%
10-Mar-2016
04-Jun-2020
Bank of England
0.10%
19-May-2020
18-Jun-2020
Bank of Japan
-0.10%
28-Jan-2016
16-Jun-2020
Reserve Bank of Australia
0.25%
18-Mar-2020
02-Jun-2020
S.Africa Reserve Bank
4.25%
14-Apr-2020
21-May-2020
Reserve Bank of India
4.40%
27-Mar-2020
03-May-2020
Bank of Mauritius
1.85%
16-Apr-2020
-
Looking for Markets correlation?
Market Correlation is a measure, statistical or observational, that gives a positive or negative link between the pricing of multiple currencies.

Bulls & Bears Levels
Resistance and Support
Levels
EUR/USD
GBP/USD
USD/JPY
USD/ZAR
R3
1.0958
1.2440
107.83
19.54
R2
1.0927
1.2390
107.55
19.34
R1
1.0873
1.2311
107.29
19.17
PP
1.0842
1.2261
107.02
18.76
S1
1.0788
1.2181
106.76
18.58
S2
1.0757
1.2132
106.48
17.99
S3
1.0703
1.2052
106.22
17.81
Technical Analysis - Forex Charts
Safe-haven nature of FRANC SWISS may plummet USD/CHF to a downfall
Chart updated on 13.04.2020
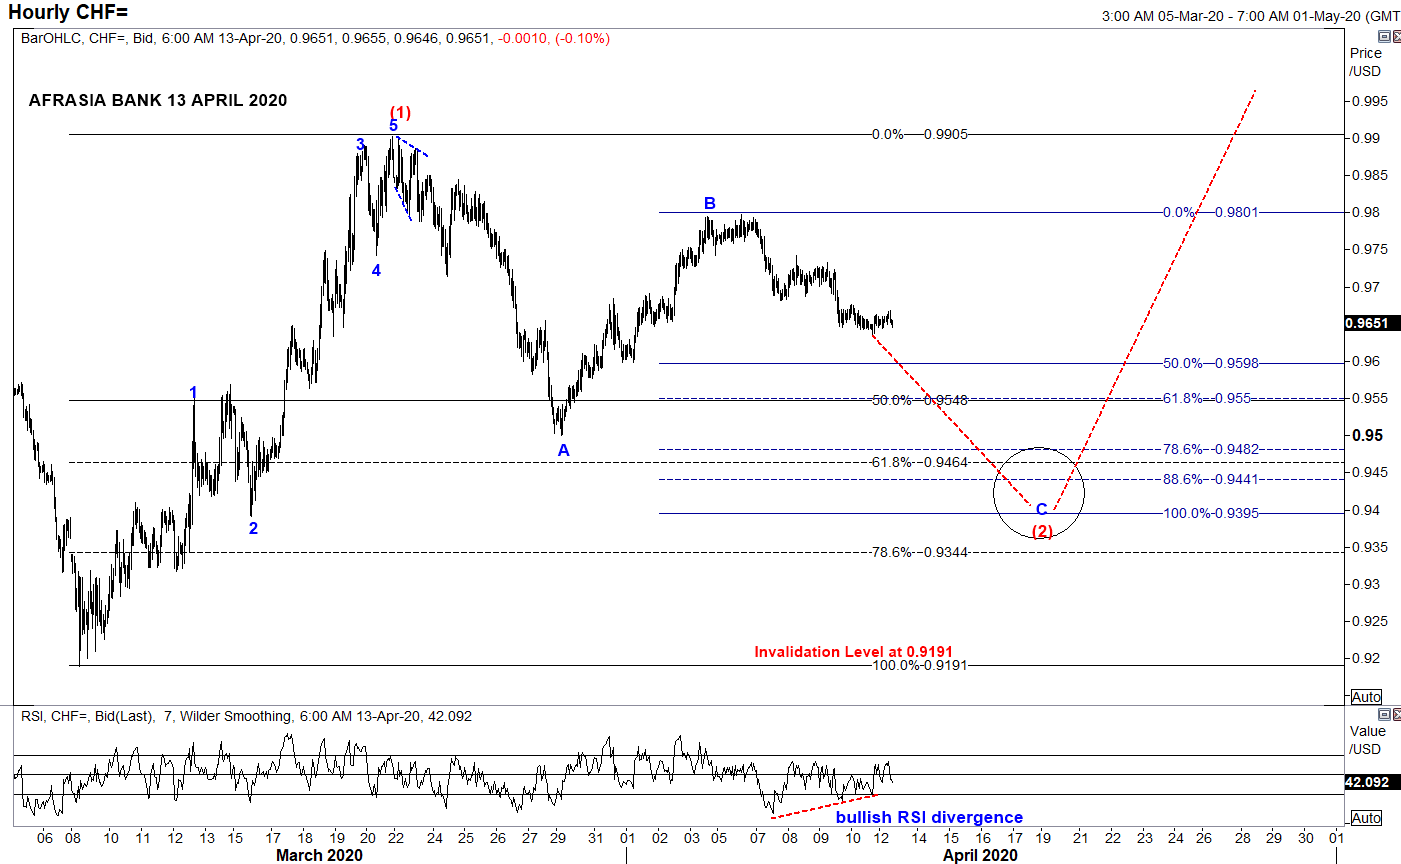
  • From an Elliott Wave standpoint, USDCHF could potentially unfold into compelling impulsive Wave C of the zigzag correction of Wave (2) to a narrowing region 0.9550 (50% retracement of Wave (1)) to 0.9395 (100% projection of Wave A through B) in the near term trend, from the downside bias from April 6th high of 0.9797.
  • Price could immediately start to shoot back up into Wave (3) on a longer perspective.
  • Piercing above the resistance 0.9905 would endorse the structure.
  • Alternatively, broader bearish invalidation of Elliott Wave Structure rest at 0.9191 of March 9th low while Relative Strength Index signals a bullish recoil higher for the pair.
Japanese Yen rebound may fizzle its way back to Safe-haven status
Chart posted on 14.04.2020

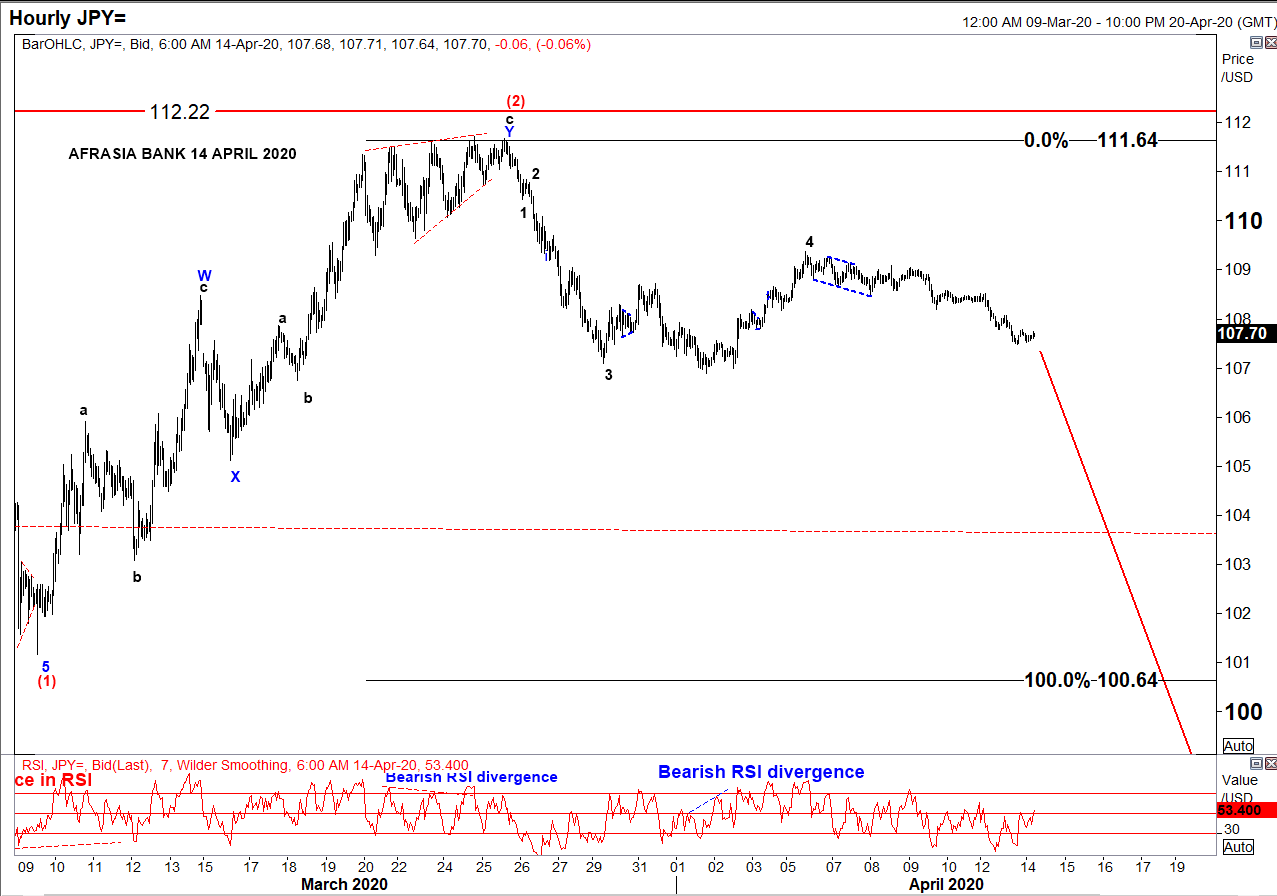
• After rallying to the downside from a high of 112.22 to 101.17 amid global pandemic threat, USD/JPY has been in a correcting mode since 9th March 2020 and seemed to have recently completed an W-X-Y Double Zig-Zag structure of Wave (2) reaching a high of 111.64 on 27th March 2020.
• Two strong indicators were flashing a trend reversal: ending diagonal at Wave 5 of Wave c and bearish RSI divergence.
• On the hourly chart, as per Elliott Wave analysis, the pair might resume its downwards trend targeting 100.64 - 93.78 to unfold Wave (3), a projection of 100%-161.8% of Fibonacci level.
• At 107.70 today, USD/JPY is percolating towards its target from 110.41 to 107.84, as per chart.
• On a side note, resumption of a bullish USD/JPY would mark an invalidation of the Elliott Wave structure above 112.22

Markey update on Biz Week by Christie Ng
Speak to our team
  • Allan Juste
    Head - Forex And Derivatives
    +230 5251 4855
  • Reshma Peerun Rajwani
    Head – Treasury Sales
    +230 403 5500
Disclaimer
Please note that the information published is purely indicative. It is based on technical data from sources which the Bank verily believes to be authentic, though its timeliness or accuracy cannot be warranted or guaranteed. AfrAsia Bank Ltd issues no invitation to anyone to rely on this bulletin and neither we nor our information providers shall be in no way whatsoever, liable for any errors or inaccuracies, regardless of cause, or the lack of timeliness, or for any delay or interruption in the transmission thereof to the user. The indicative rates and other market information are subject to changes at the Bank's discretion. Whilst every effort is made to ensure the information is accurate, you should confirm the latest situation with the Bank prior to making any decisions.