
“Knowing is not enough; we must apply. Willing is not enough; we must do. "
USD
EUR/USD
The Single currency bounced off from the previous session's seven-week low at $1.0760 to $1.0817 on Friday after the Germany Producer Price Index (PPI) data rose to 0.3% in April came in stronger than expected, adding the weight of more interest rate hikes by the European Central bank.
GBP/USD
The Cable spiked to $1.2452 as economic data on Friday showed confidence returning to the U.K. housing market as British homes jumped by 1.8% in May, more than in any month this year.
USD/JPY
The Japanese yen reversed some losses to 137.90 post interview of former Bank of Japan (BOJ) Chief Economist Toshitaka Sekine, who is targeting the Central Bank of Japan to raise the yield target in June 2023, which could point to a rise in the inflation trend rate from 0% to 1%.
AUD/USD
The Aussie is back and forth at $0.6640 amid a key meeting between U.S. President Joe Biden and House Republican Speaker Kevin Mc Carthy to discuss the U.s. debt ceiling on Monday.
USD/CAD
The Loonie ticked down to 1.3509 though Canada Core Retail Sales data released on Friday was higher than expected to -0.3% for March 2023 versus -0.7% for February 2023.
USD/ZAR
The rand displayed a steep drop to a new record low of 19.50 against the greenback, undermined by a worsening energy crisis that threatened South Africa's economic outlook.
USD/MUR
The dollar-rupee fell by 5 cents to 46.00 (Selling) this morning.
16.30 CAD Core Retail Sales (MoM)
19.00 USD Fed Chair Powell Speaks
23.00 EUR ECB President Lagarde Speaks


As expected, the EUR/USD has been on a steep uptrend since September 2022 on hawkish ECB.
Elliott wave pattern
Daily Chart
A Clear impulsive 5-wave structure from a low of $0.9534 to a high of $ 1.1035 in February 2023
Possible Expanding Diagonal in wave c of wave b of a flat correction
Forecast
Short term
We expect a corrective setback in wave C in the coming month
1st target 1.1.0670 Wave a =Wave C of a flat correction
2nd Target 1.0530- Wave a =127.2% of wave C of a flat correction
Long term
Once the pullback is completed, we might see the EUR/USD jumping out of the block to $1.1560, followed by $1.2000 by year-end of 2023
News
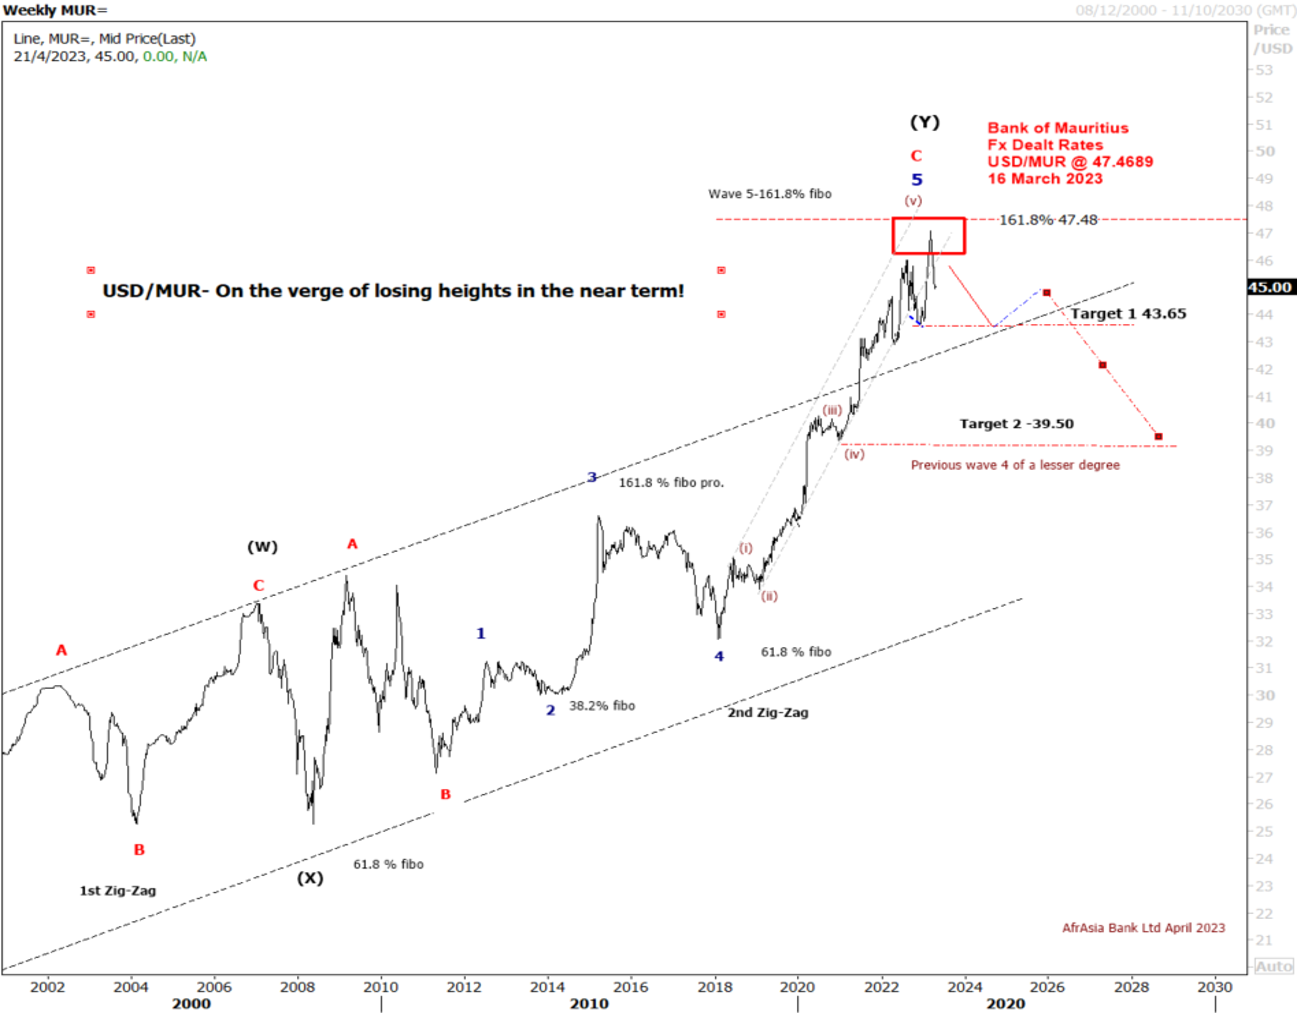
The USD/MUR suddenly burst to a new high at 47.48 in March, driven by FX liquidity concerns, before BOM stepped in to smooth the excessive volatility and injected USD 30 mio on the domestic market.
The USD/MUR fell sharply to 45.40 in the wake of three interventions of the Bank of Mauritius from March 2023 to date.
Elliott wave pattern- Weekly Chart
Double zig-zag upward correction in wave W-X-Y, since 2000 completed!
Bearish turn ahead!
Clear 5-wave structure in wave 5 of wave C of wave (Y)
Over the last four years, the USD/MUR surged by 42% from a low of 32.90 in wave 4 to reach an all-time high of 47.47 on 16th of March 2023, before falling back to 45.40 in an impulsive decline from Mid-March to late April 2023
Forecast- USD/MUR on the brink of a downturn in Q2-Q4 of 2023
On the weekly USD/MUR chart, It seems that the pair may have completed a five-wave upward rally in sub-wave (v) of Wave 5 of Wave C of Wave Y with a peak of 47.47 on the 16th of March
Our Short term target is for a downward trend towards 44.00 followed by 43.00 in December 2023
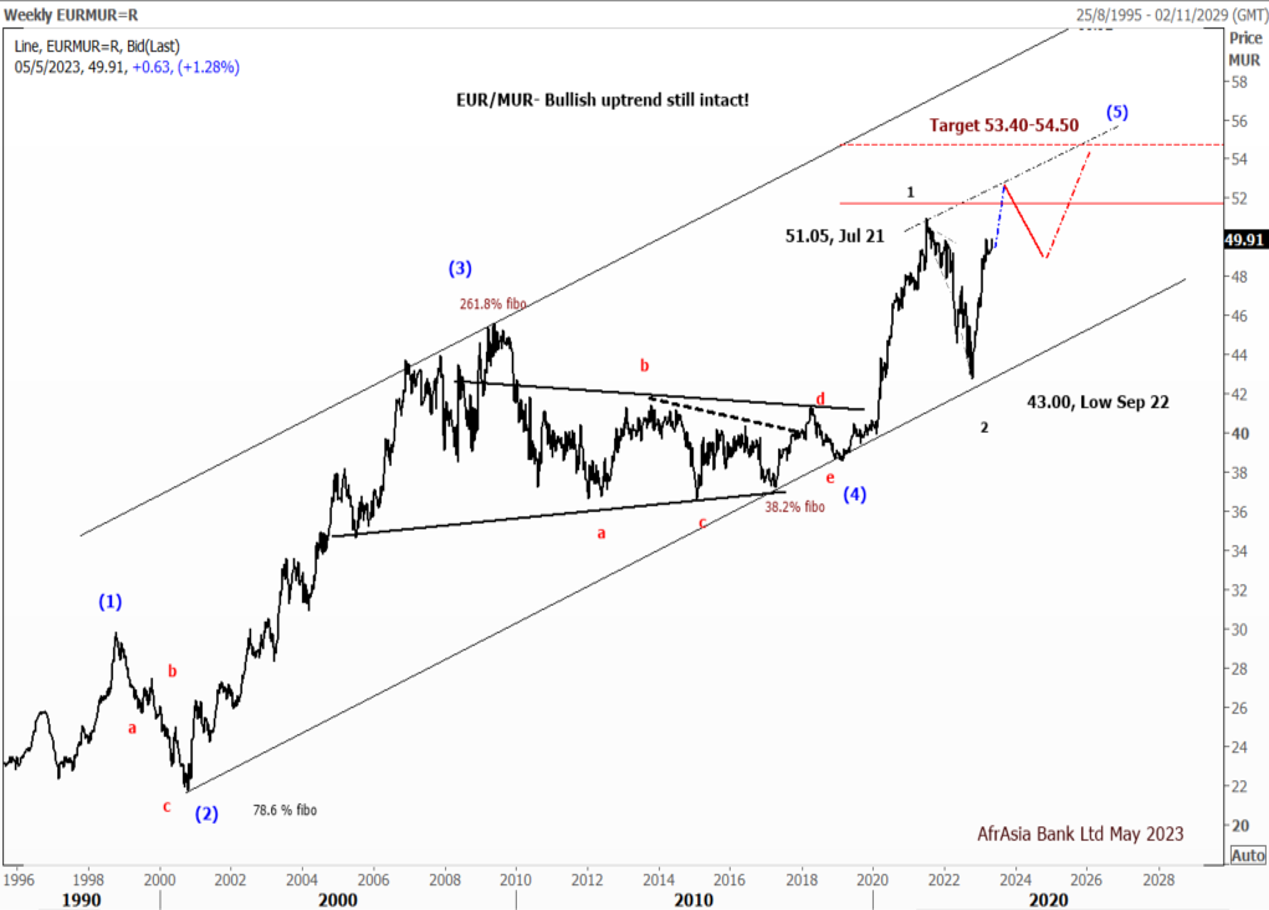
Forecast
EUR/MUR- On the weekly chart, the EUR/MUR may extend its rally in the short term above the high of 51.05 printed in July 2021.
From a technical perspective, on a break of the previous high at 51.05, the pair may find resistance at 52.00, followed by 52.50 by June 2023.
However, we expected the pair to pare some of its gains to 48.50 by September 2023 before a resumption of the uptrend to 53.40-54.50 by December 2023
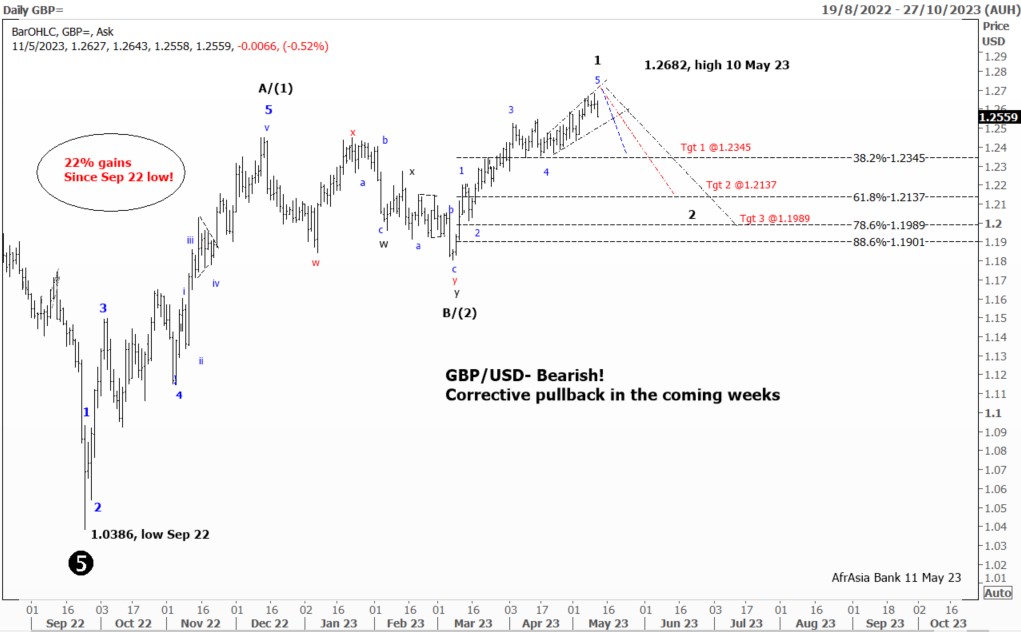
The Pound has bagged about 5.7% against the U.S. dollar this year to reach a 1-year high of $1.2682 on the 10th of May 2023 and is up some 17% from lows hit $1.0386 in the wake of September’s disastrous mini-budget.
From an Elliott Wave perspective, the GBP/USD remains in a long-term uptrend but could feel the pain of a corrective setback in the upcoming weeks. A break below the bullish trend channel at $1.2500 would open the door for further decline near $1.2345 (previous wave 4 of a lesser degree), followed by $1.2337 (61.8% Fibonacci retracement from a high of 1.2682), and lastly at $1.1900 (78.6% Fibonacci retracement). On the upside, stiff resistance has formed at 1.2645 and 1.2680 could be seen as the next bullish target.