
I'd rather attempt to do something great and fail than to attempt to do nothing and succeed.
USD
EURUSD
The euro remained confined inside a narrow trading range around $1.0760 for the second straight day as the market shifted focus to U.S. CPI for fresh impetus amid dovish Fed/ECB pricing.
GBPUSD
The pound sterling inched above 1.2550 against the greenback early this morning as the pair recovered some lost ground ahead of interest rate decisions from the Federal Reserve and the Bank of England later in the week.
USDJPY
The Japanese Yen snapped a two-day losing streak to trade around 145.50 against the USD ahead of a slew of central bank policy decisions this week and the Bank of Japan next week.
AUDUSD
The Australian dollar gained to 0.6595 versus the U.S. dollar on hawkish comments from RBA Governor Michele Bullock, who emphasized a cautious approach, focused on data, and highlighted the RBA's commitment to preserving employment gains.
USDCAD
The Canadian dollar edged higher to the vicinity of 1.3550 against its U.S. counterpart as oil prices rose and investors bet that the Federal Reserve would not raise interest rates at a meeting this week.
USDZAR
The South African rand meandered at 19.02 against the U.S. dollar ahead of local and global economic data releases this week.
USDMUR
The dollar-rupee stayed put at 44.60 (selling) this morning.
11:00 GBP ILO Unemployment Rate
11:00 GBP Claimant Count Change
14:00 EUR EU ZEW Survey - Economic Sentiment
14:00 EUR German ZEW Survey
17:30 USD Consumer Price Index
17:30 USD Consumer Price Index ex Food & Energy

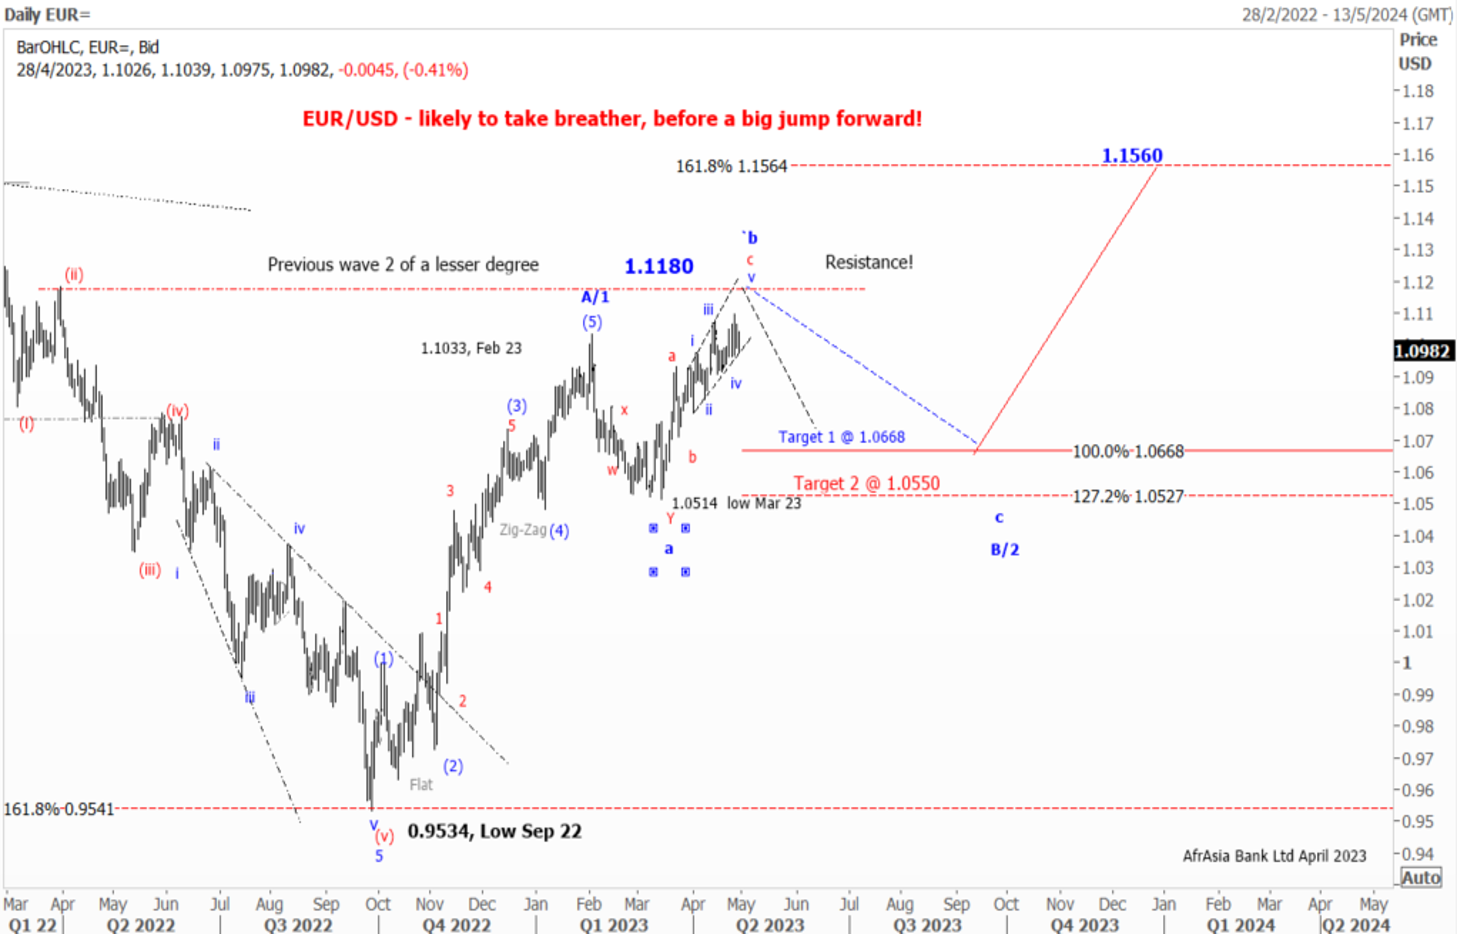
As expected, the EUR/USD has been on a steep uptrend since September 2022 on hawkish ECB.
Elliott wave pattern
Daily Chart
A Clear impulsive 5-wave structure from a low of $0.9534 to a high of $ 1.1035 in February 2023
Possible Expanding Diagonal in wave c of wave b of a flat correction
Forecast
Short term
We expect a corrective setback in wave C in the coming month
1st target 1.1.0670 Wave a =Wave C of a flat correction
2nd Target 1.0530- Wave a =127.2% of wave C of a flat correction
Long term
Once the pullback is completed, we might see the EUR/USD jumping out of the block to $1.1560, followed by $1.2000 by year-end of 2023
News
The USD/MUR suddenly burst to a new high at 47.48 in March, driven by FX liquidity concerns, before BOM stepped in to smooth the excessive volatility and injected USD 30 mio on the domestic market.
The USD/MUR fell sharply to 45.40 in the wake of three interventions of the Bank of Mauritius from March 2023 to date.
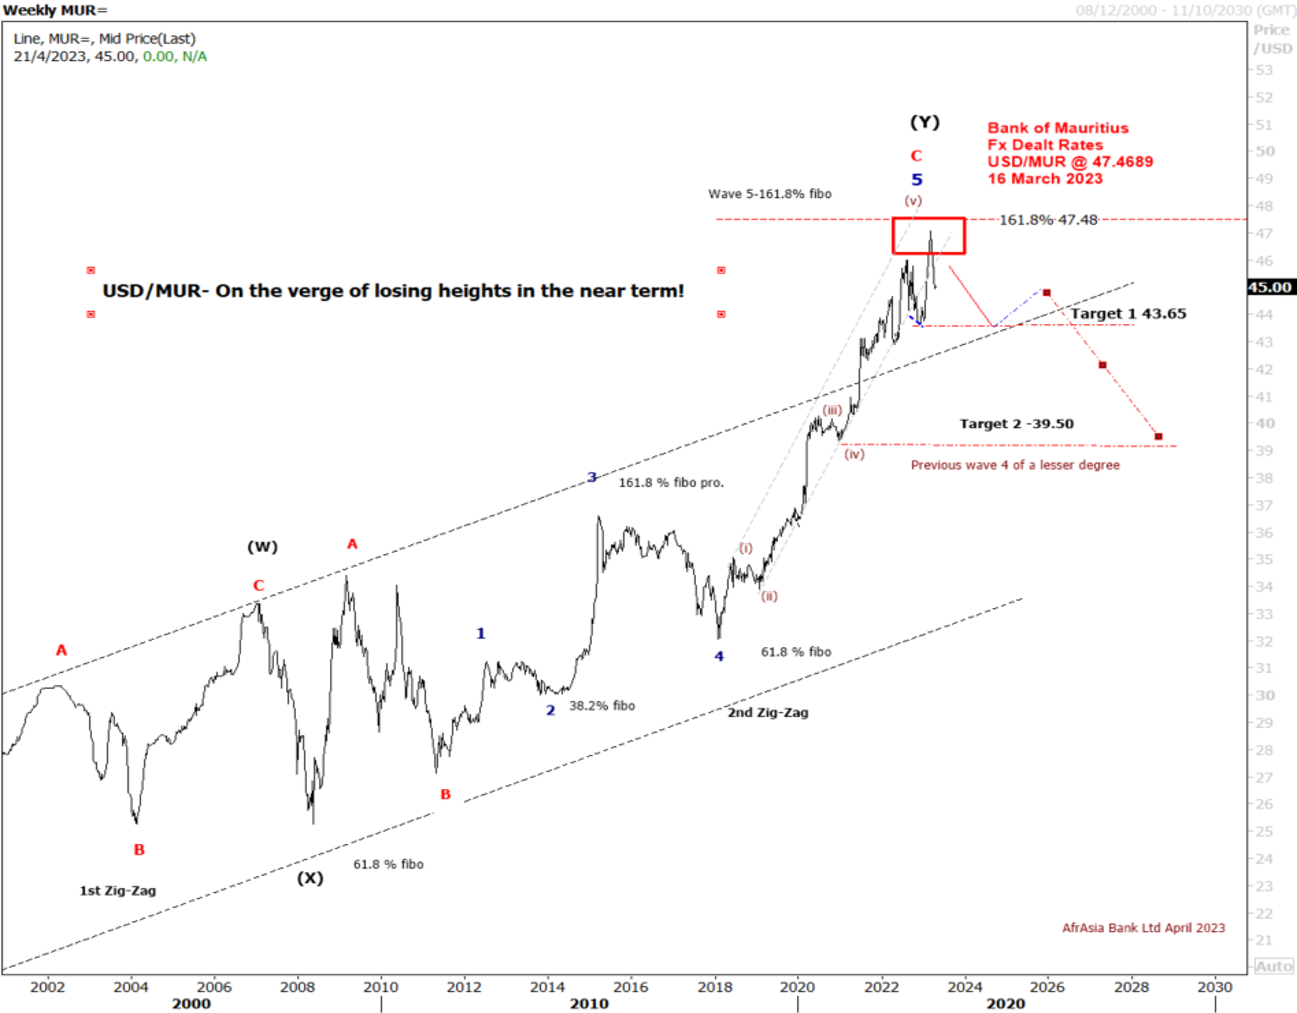
Elliott wave pattern- Weekly Chart
Double zig-zag upward correction in wave W-X-Y, since 2000 completed!
Bearish turn ahead!
Clear 5-wave structure in wave 5 of wave C of wave (Y)
Over the last four years, the USD/MUR surged by 42% from a low of 32.90 in wave 4 to reach an all-time high of 47.47 on 16th of March 2023, before falling back to 45.40 in an impulsive decline from Mid-March to late April 2023
Forecast- USD/MUR on the brink of a downturn in Q2-Q4 of 2023
On the weekly USD/MUR chart, It seems that the pair may have completed a five-wave upward rally in sub-wave (v) of Wave 5 of Wave C of Wave Y with a peak of 47.47 on the 16th of March
Our Short term target is for a downward trend towards 44.00 followed by 43.00 in December 2023
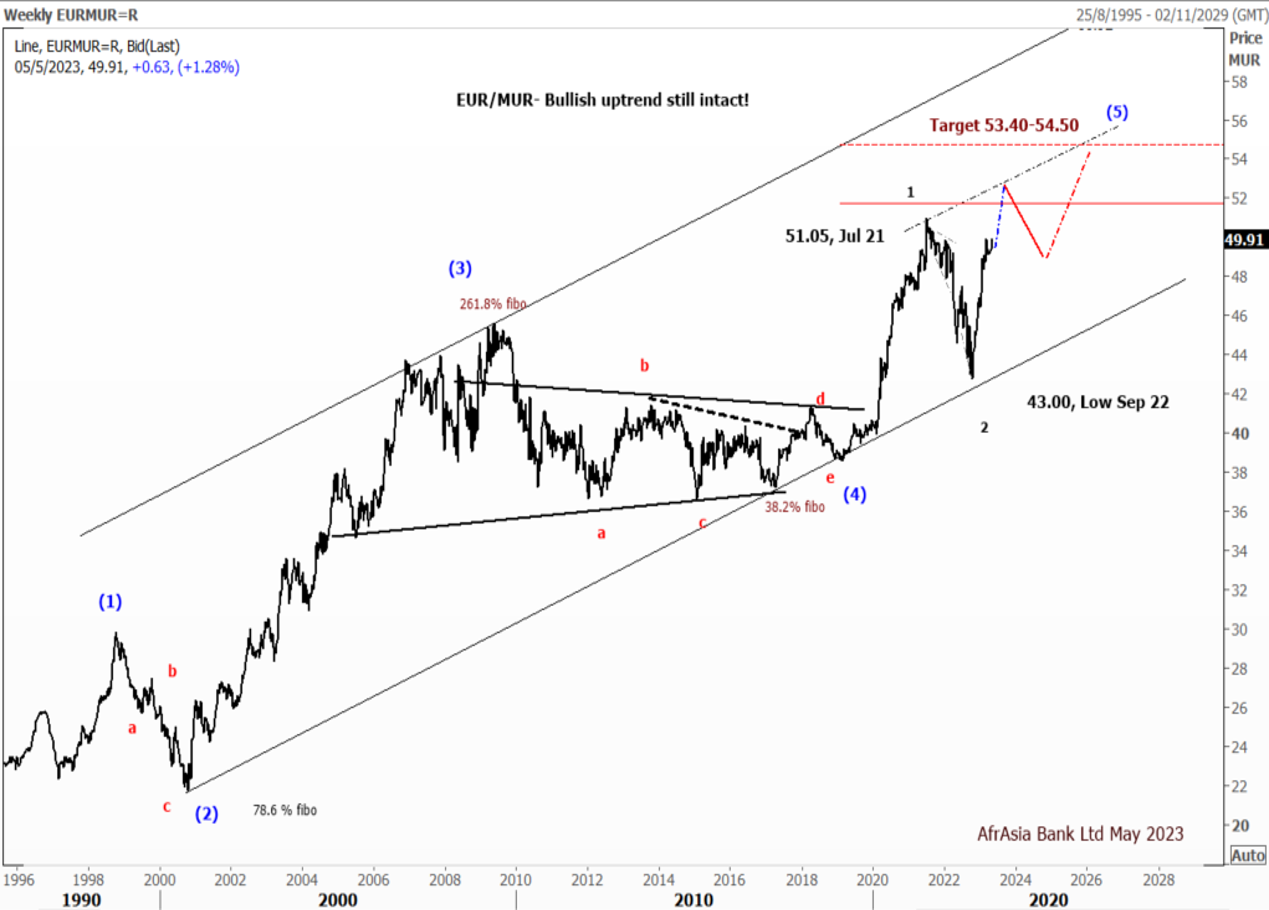
Forecast
EUR/MUR- On the weekly chart, the EUR/MUR may extend its rally in the short term above the high of 51.05 printed in July 2021.
From a technical perspective, on a break of the previous high at 51.05, the pair may find resistance at 52.00, followed by 52.50 by June 2023.
However, we expected the pair to pare some of its gains to 48.50 by September 2023 before a resumption of the uptrend to 53.40-54.50 by December 2023
The Pound Sterling is experiencing a lot of selling pressure against the U.S. dollar due to the ongoing risk aversion theme. The Bank of England's aggressive monetary policy tightening is also causing concern for the U.K. economy, as it may not pause the policy tightening spell in time.
Additionally, Britain's Consumer Price Index (CPI) is currently the highest among G7 economies, which may require more rate hikes in the future. However, UK Finance Minister Jeremy Hunt has reassured the public that the administration is working to bring inflation down to almost 5% by year-end.
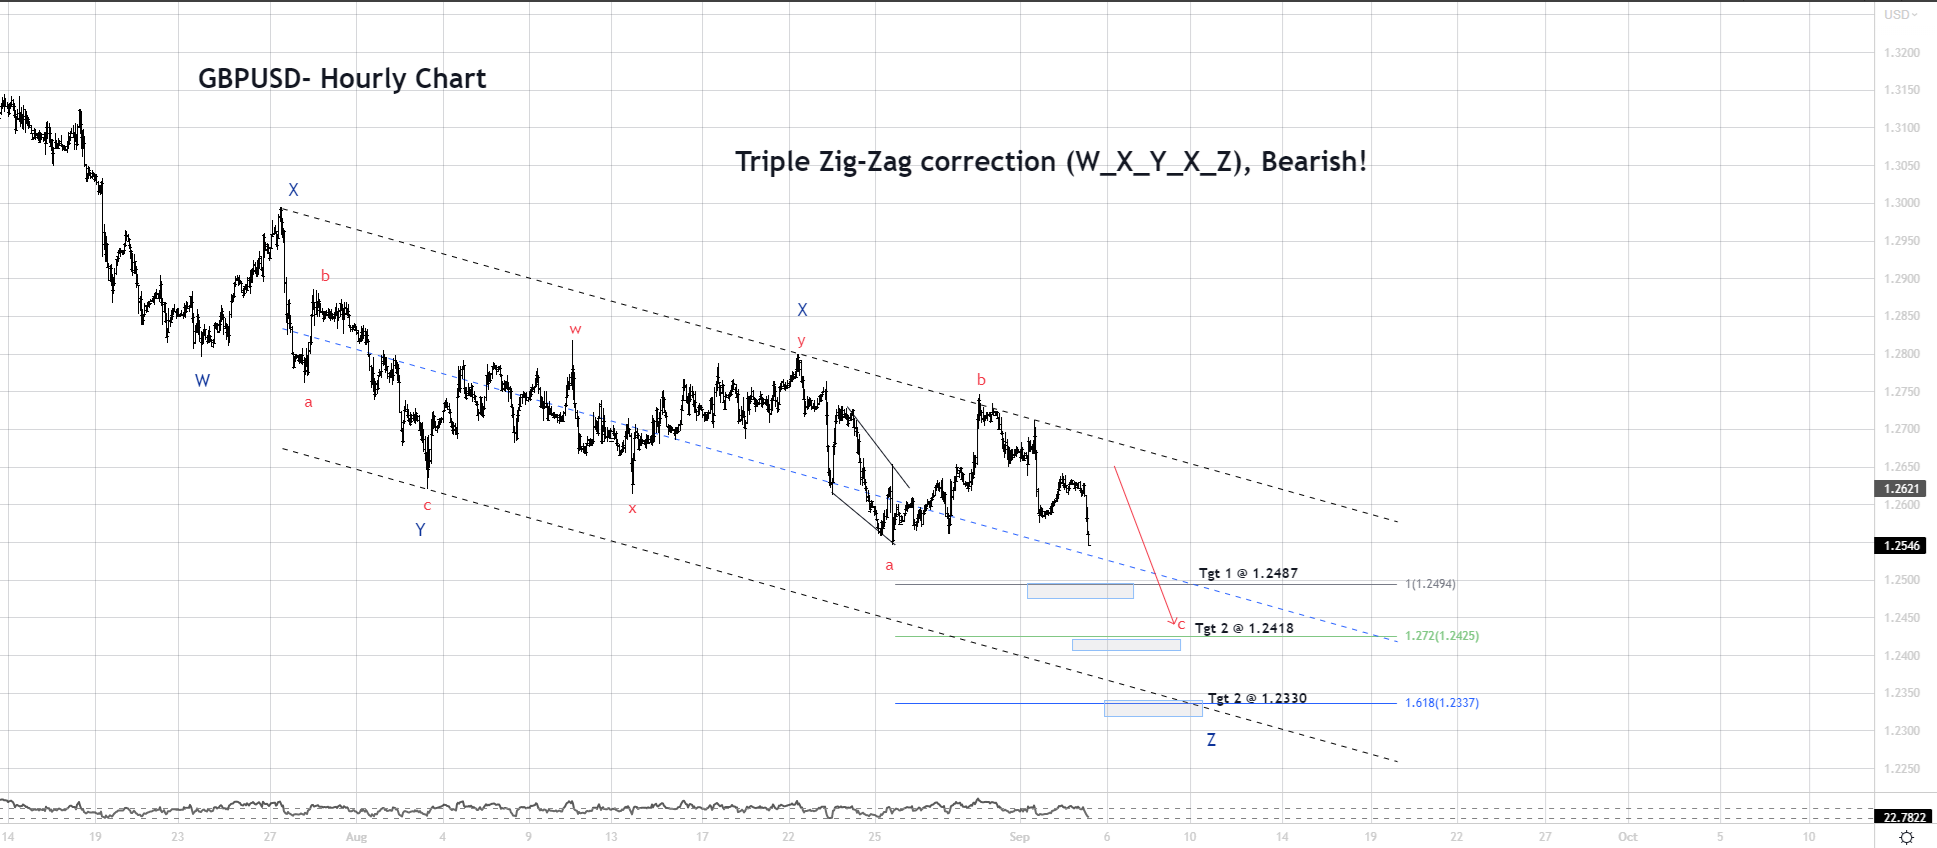
From a technical standpoint, the GBP/USD is still trapped in a Triple Zig-Zag Correction on the Hourly Chart. This could potentially lead to the pound reaching new lows in the coming sessions/days.
The downside targets are as follows:
- Target 1 @ 1.2487
- Target 2 @1.2418
- Target 3 @ 1,2330
On the flip side, if the pound were to move back to $1.2641 and 1.2710, it would invalidate the bearish count!
News
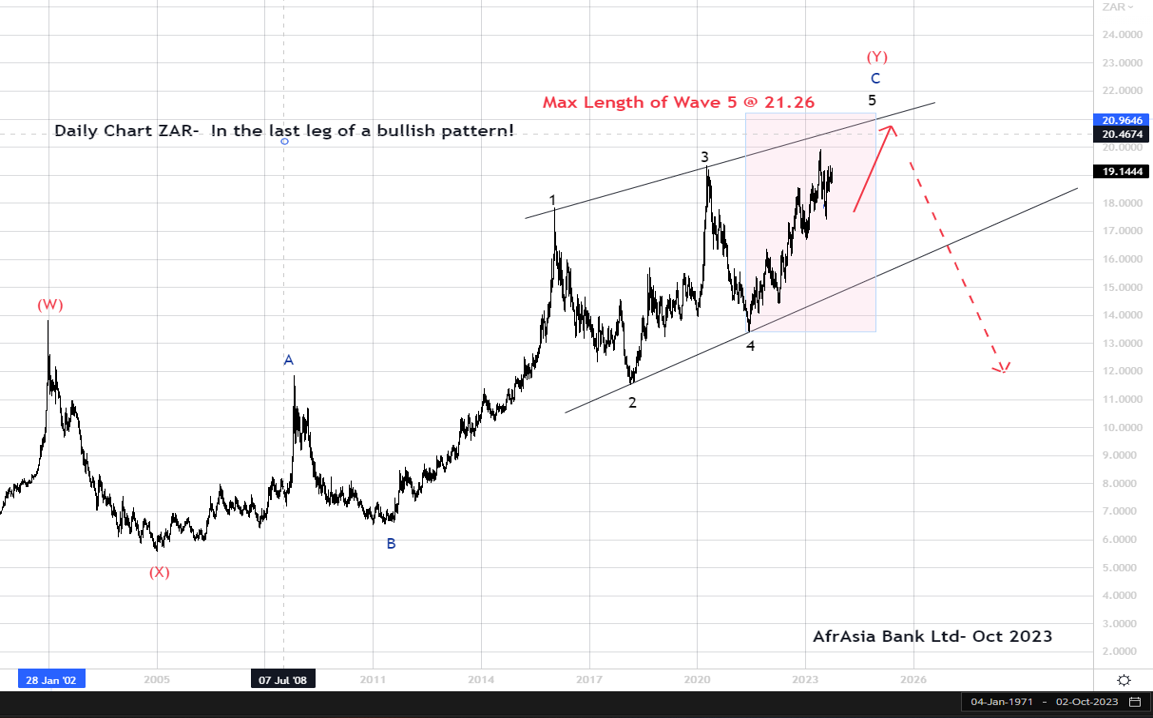
The Rand has experienced a 10.3% decrease against the U.S. dollar in Q3 of 2023. This is due to a less optimistic economic outlook, which has been impacted by the Eskom power supply issues in South Africa.
Technical Outlook
A Diagonal pattern in wave C of wave (Y) is still underway.
Looking at the Elliott wave pattern, the USD/ZAR Daily Chart reveals a Diagonal pattern in wave C of wave (Y) is still in progress. The overall pattern from January 2011 to October 2023 appears to be forming a Clear 5-wave motive
structure (Diagonal) in wave C of wave (Y).
Forecast
We anticipate the USD/ZAR to gradually increase to a maximum of 21.26 in the upcoming months before reversing in the first quarter of 2024.
1st target 19.92- high of May 2023
2nd Target 20.65- upper trendline connecting wave 1-3
3rd Target 21.26- Maximum length of Wave 5 of wave C

