Internet Banking
Click icon again to close

Treasury

Daily Market Patrol

Market Patrol 7 March 2022

“Cut your losses. Cut your losses. Cut your losses. Then maybe you have a chance.” 

Ed Seykota
Indicative Selling Rates
against MUR
USD
19 Apr 2024
  • AUD
  • 30.42
  • 0.6459
  • BWP
  • 3.47
  • 0.0737
  • CAD
  • 34.46
  • 1.3664
  • CNY
  • 6.60
  • 7.1402
  • DKK
  • 6.82
  • 6.9093
  • EUR
  • 50.34
  • 1.0691
  • HKD
  • 6.10
  • 7.7148
  • INR
  • 0.57
  • 82.1874
  • JPY
  • 30.85
  • 152.6385
  • KES
  • 35.97
  • 130.9049
  • NZD
  • 27.96
  • 0.5937
  • NOK
  • 4.35
  • 10.8251
  • SGD
  • 34.91
  • 1.3490
  • ZAR
  • 2.53
  • 18.6446
  • SEK
  • 4.35
  • 10.8361
  • CHF
  • 52.18
  • 1.1081
  • GBP
  • 58.79
  • 1.2484
  • USD
  • 47.09
  • 1.0000
  • AED
  • 13.02
  • 3.6162
The Euro hit its weakest level since May 2020 against the U.S dollar on E.U. inflationary pressure
Fundamental News

EUR/USD
The Shared currency hit its weakest level since May 2020 at $1.0822 as stagflation talks creep in amid a declining economic growth coupled with rampant inflation.


GBP/USD
The Cable plunged to fresh lows of 2022 at $ 1.3185 and is currently trading at $1.3220 amid extended dumping in risk-sensitive assets—Markets eyes for retail sales, Gross Domestic Product and trade balance data this week.


USD/JPY
The Japanese yen eased to 114.95, weighed down by hawkish comments from Fed policymakers and robust U.S. jobs reports.


AUD/USD
The Aussie dollar pushed to $0.7414 against the greenback on rising commodity prices.


USD/CAD
The Loonie trod water at 1.2710 against the U.S. dollar as crude oil prices surged after U.S. chief diplomat Blinken said that the White House is in talks with European allies over a proposal to ban Russian oil imports.


USD/ZAR
South African rand remained on the backfoot at 15.39 as investors are concerned about the impact of soaring oil prices on the local economy. 


USD/MUR
The dollar-rupee rallied higher to 44.55(Selling).

Fundamental & Technical Data
Economic Indicators-Local Time

10:45 - CHF - Unemployment Rate 

13:30 - EUR - Sentix Investors confidence


Central Bank Interest Rates
Last Change
New Meeting
Federal Bank of U.S
0.00%-0.25%
16-Mar-2020
16-Mar-2022
European Central Bank
0.00%
10-Mar-2016
31-Mar-2022
Bank of England
0.50%
03-Feb-2022
17-Mar-2022
Bank of Japan
-0.10%
28-Jan-2016
18-Mar-2022
Reserve Bank of Australia
0.10%
03-Nov-2020
01-Mar-2022
S.Africa Reserve Bank
4.00%
28-Jan-2022
24-Mar-2022
Reserve Bank of India
4.00%
22-May-2020
-
Bank of Mauritius
1.85%
16-Apr-2020
-
Looking for Markets correlation?
Market Correlation is a measure, statistical or observational, that gives a positive or negative link between the pricing of multiple currencies.

Bulls & Bears Levels
Resistance and Support
Levels
EUR/USD
GBP/USD
USD/JPY
USD/ZAR
R3
1.1125
1.3362
115.97
15.77
R2
1.1088
1.3305
115.72
15.66
R1
1.0935
1.3262
115.55
15.48
PP
1.0869
1.3205
115.30
15.37
S1
1.0820
1.3187
115.13
15.16
S2
1.0800
1.3133
114.88
15.04
S3
1.0725
1.3100
114.60
14.86
Technical Analysis - Forex Charts
Technical Outlook of the week - NZDCHF Scenario 1:
Chart updated on 04.03.2022

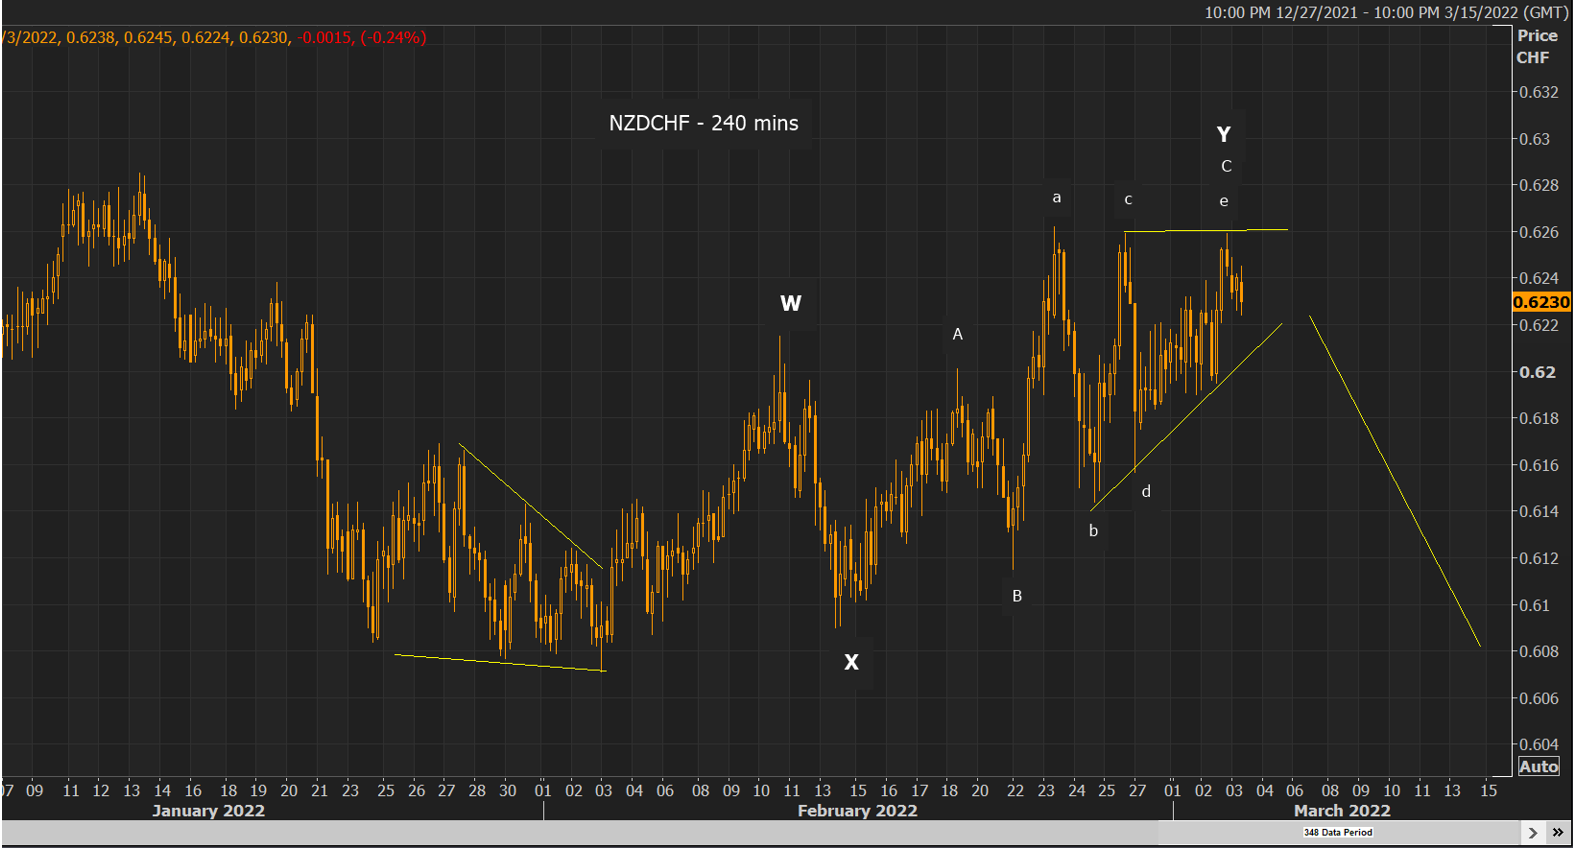
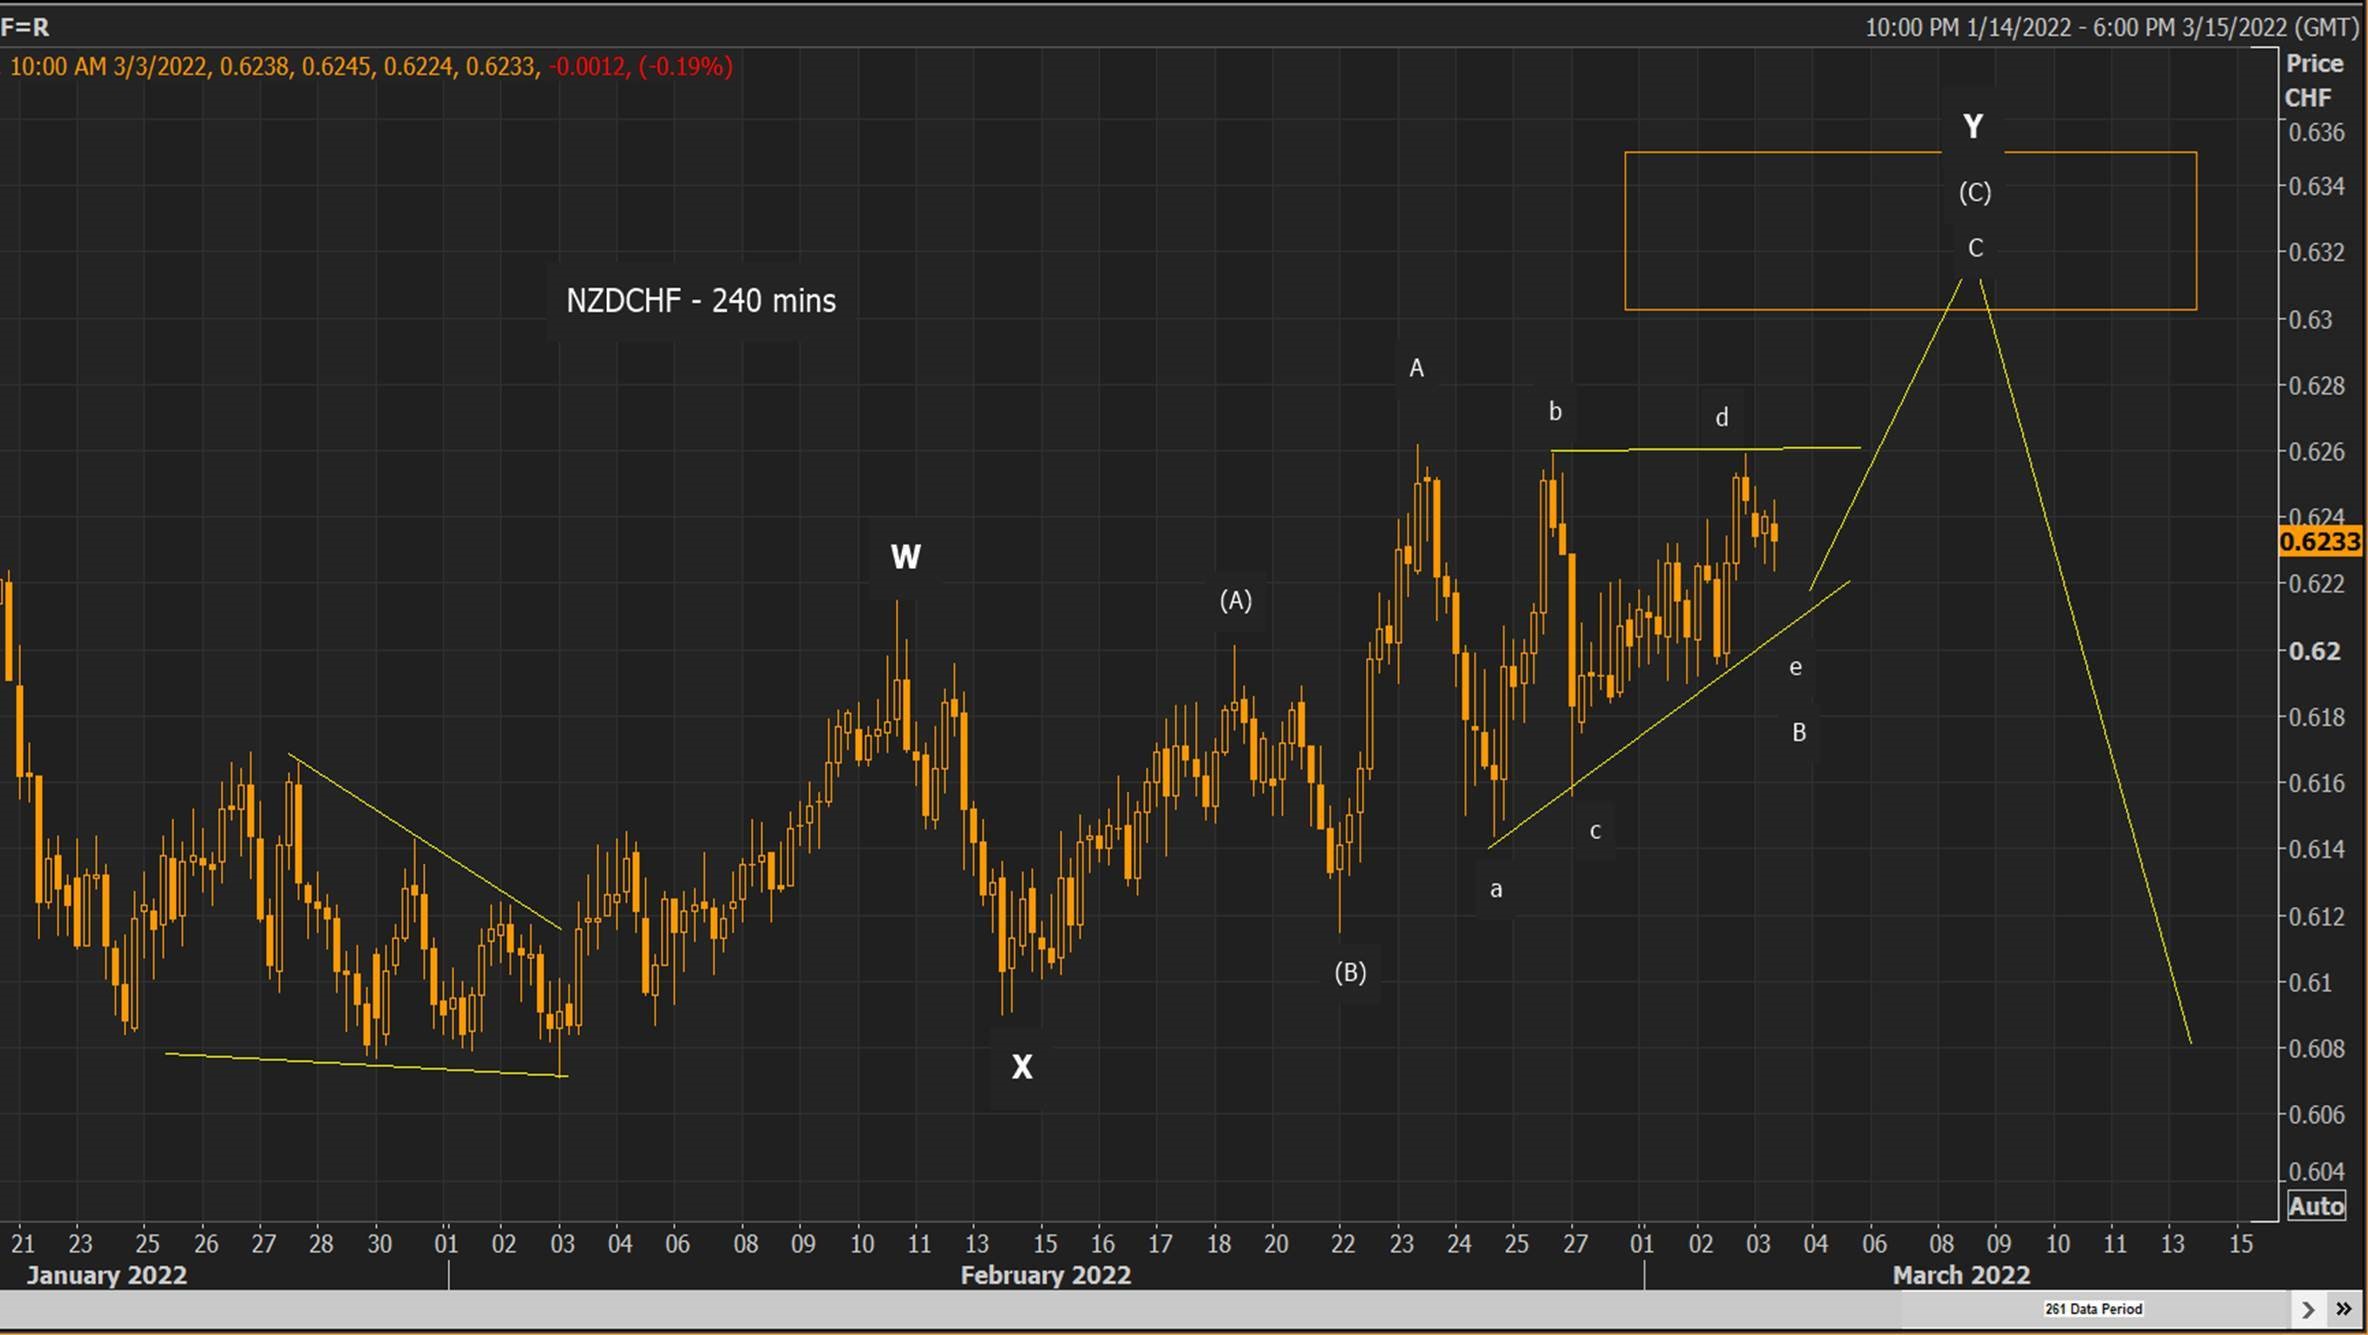
After bouncing back from key resistance level 0.6262 from the upside as per our last forecast (see below) , NZDCHF sworn down to 0.6144 but lacked sufficient selling pressure to continue its downtrend.

It appears that final wave Y of W-X-Y correction is quite complex and there might be 2 scenarios popping up in the near term.

Scenario 1 : we could have reached final wave ‘e’ before downtrend resumes. (As per Elliott wave principle a triangle can be formed as final wave C of wave Y  of  W-X-Y correction)

                      Key resistance level is wave ‘e’ of barrier triangle of wave C – 0.6259.

Technical Outlook of the week - NZDCHF Scenario 2:
Chart posted on 04.03.2022
Markey update on Biz Week by Christie Ng
Speak to our team
  • Allan Juste
    Head - Forex And Derivatives
    +230 5251 4855
  • Reshma Peerun Rajwani
    Head – Treasury Sales
    +230 403 5500
Disclaimer
Please note that the information published is purely indicative. It is based on technical data from sources which the Bank verily believes to be authentic, though its timeliness or accuracy cannot be warranted or guaranteed. AfrAsia Bank Ltd issues no invitation to anyone to rely on this bulletin and neither we nor our information providers shall be in no way whatsoever, liable for any errors or inaccuracies, regardless of cause, or the lack of timeliness, or for any delay or interruption in the transmission thereof to the user. The indicative rates and other market information are subject to changes at the Bank's discretion. Whilst every effort is made to ensure the information is accurate, you should confirm the latest situation with the Bank prior to making any decisions.