Internet Banking
Click icon again to close

Treasury

Daily Market Patrol

Market Patrol 6 May 2020

If two people always agree, one of them is redundant.
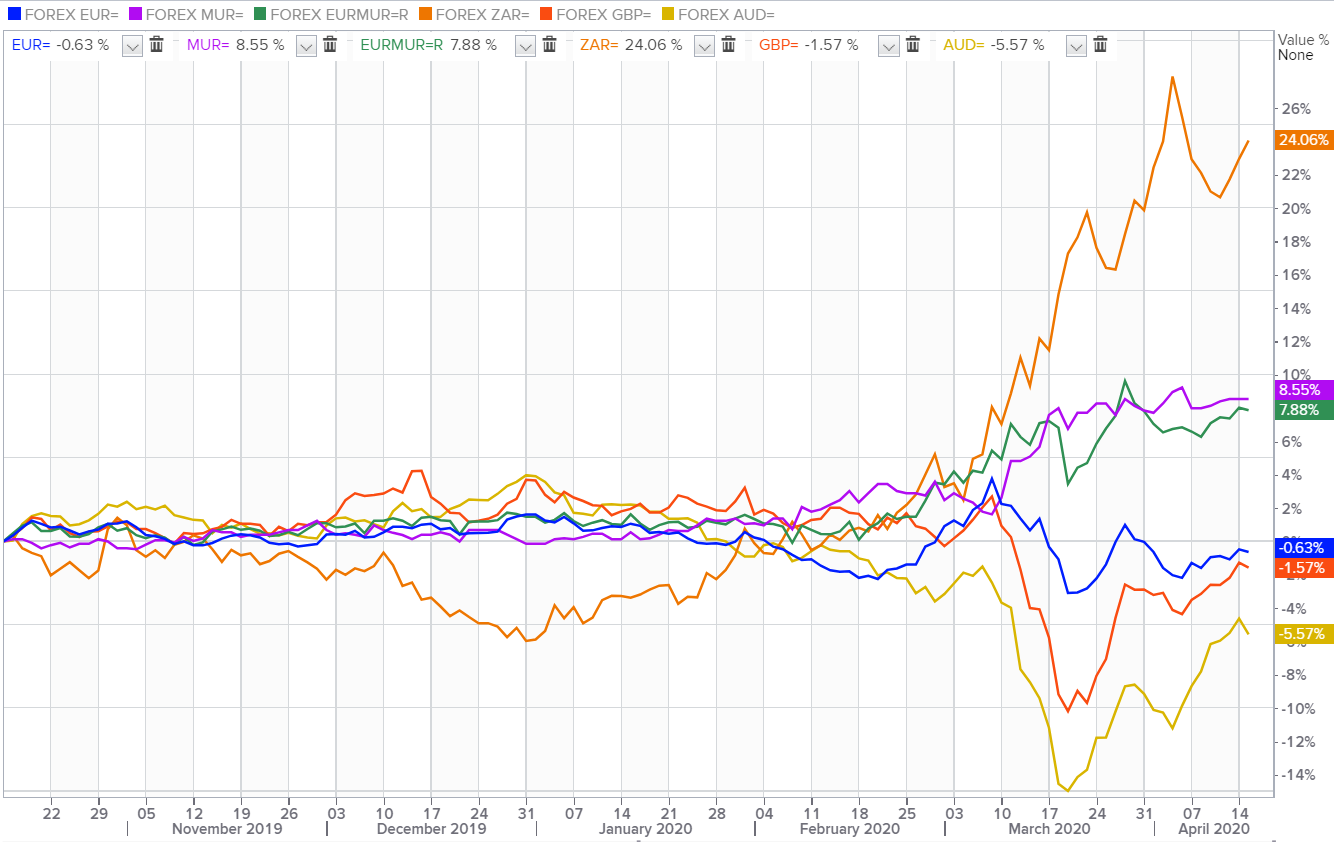
Ben Bernanke
Indicative Selling Rates
against MUR
USD
19 Apr 2024
  • AUD
  • 30.42
  • 0.6459
  • BWP
  • 3.47
  • 0.0737
  • CAD
  • 34.46
  • 1.3664
  • CNY
  • 6.60
  • 7.1402
  • DKK
  • 6.82
  • 6.9093
  • EUR
  • 50.34
  • 1.0691
  • HKD
  • 6.10
  • 7.7148
  • INR
  • 0.57
  • 82.1874
  • JPY
  • 30.85
  • 152.6385
  • KES
  • 35.97
  • 130.9049
  • NZD
  • 27.96
  • 0.5937
  • NOK
  • 4.35
  • 10.8251
  • SGD
  • 34.91
  • 1.3490
  • ZAR
  • 2.53
  • 18.6446
  • SEK
  • 4.35
  • 10.8361
  • CHF
  • 52.18
  • 1.1081
  • GBP
  • 58.79
  • 1.2484
  • USD
  • 47.09
  • 1.0000
  • AED
  • 13.02
  • 3.6162
EUR/USD under pressure after German Constitutional Court ruled that part of the ECB’s bond buying program breach their mandate.
Fundamental News

EUR/USD
The single currency plummeted to $1.0838 following Germany's highest court on Tuesday gave the European Central Bank three months to justify purchases under its bond-buying programme, or lose the Bundesbank as a participant in a scheme aimed at cushioning the economic blow from the coronavirus.


GBP/USD
The cable tumbled to $1.2430 as UK's death toll from COVID-19 is nearing 30,000, surpassing Italy despite substantially flattening the curve.


USD/JPY
The yen soared to 106.30 per dollar on worries about a bumpy global recovery spooked investors amid the constitution Day holiday in Japan, while U.S ISM Non-Manufacturing Purchasing Managers' Index plunged to 41.8 points in April.


AUD/USD
The Australian dollar percolated around $0.6444 despite Australian retail sales rose 8.5% year-on-year in March, where the rise in spending could be associated with the panic buying seen ahead of the coronavirus-induced lockdown.


USD/ZAR
The South African rand cascaded to 18.42 against the greenback as markets are awaiting a retaliation from Beijing on a threat of fresh tariffs on Chinese goods from America.


USD/MUR
On the domestic market, the USD/MUR extended gains for the third trading day of the month by 20 cents to 40.70(selling) underpinned by U.S dollar strength.

Fundamental & Technical Data
Economic Indicators-Local Time

12:30 - GBP - Construction PMI (Apr)

16:15 - USD - ADP Nonfarm Employment Change (Apr)

18:30 - USD - Crude Oil Inventories


Central Bank Interest Rates
Last Change
New Meeting
Federal Bank of U.S
0.00-0.25%
16-Mar-2020
10-Jun-2020
European Central Bank
0.00%
10-Mar-2016
04-Jun-2020
Bank of England
0.10%
19-May-2020
07-May-2020
Bank of Japan
-0.10%
28-Jan-2016
16-Jun-2020
Reserve Bank of Australia
0.25%
18-Mar-2020
05-May-2020
S.Africa Reserve Bank
4.25%
14-Apr-2020
21-May-2020
Reserve Bank of India
4.40%
27-Mar-2020
03-May-2020
Bank of Mauritius
1.85%
16-Apr-2020
-
Looking for Markets correlation?
Market Correlation is a measure, statistical or observational, that gives a positive or negative link between the pricing of multiple currencies.

Bulls & Bears Levels
Resistance and Support
Levels
EUR/USD
GBP/USD
USD/JPY
USD/ZAR
R3
1.1004
1.2536
107.31
19.54
R2
1.0965
1.2510
107.10
19.34
R1
1.0904
1.2473
106.84
19.17
PP
1.0865
1.2447
106.63
18.76
S1
1.0804
1.2410
106.36
18.58
S2
1.0765
1.2383
106.15
17.99
S3
1.0704
1.2346
105.88
17.81
Technical Analysis - Forex Charts
Safe-haven nature of FRANC SWISS may plummet USD/CHF to a downfall
Chart updated on 13.04.2020
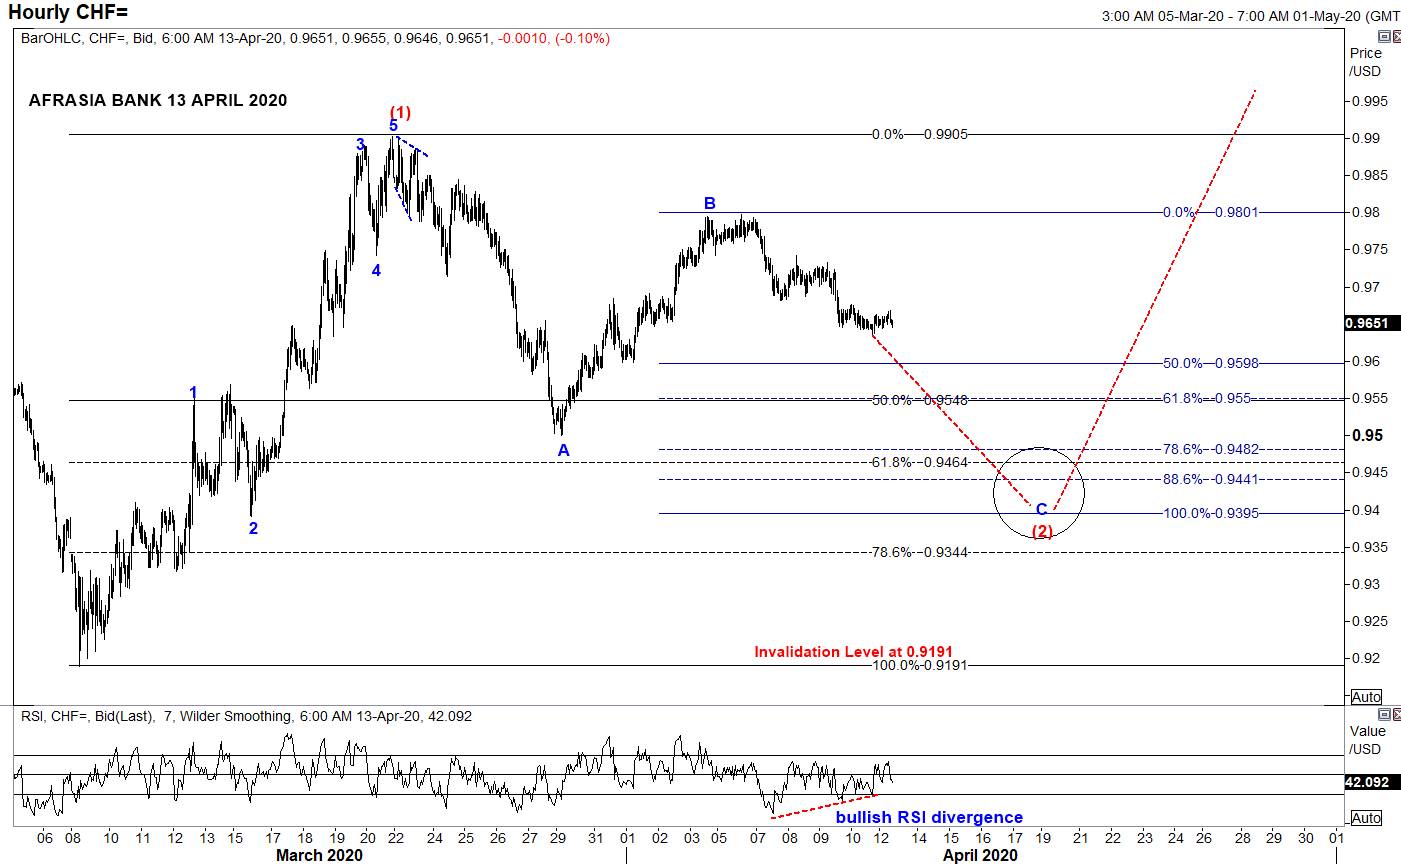
  • From an Elliott Wave standpoint, USDCHF could potentially unfold into compelling impulsive Wave C of the zigzag correction of Wave (2) to a narrowing region 0.9550 (50% retracement of Wave (1)) to 0.9395 (100% projection of Wave A through B) in the near term trend, from the downside bias from April 6th high of 0.9797.
  • Price could immediately start to shoot back up into Wave (3) on a longer perspective.
  • Piercing above the resistance 0.9905 would endorse the structure.
  • Alternatively, broader bearish invalidation of Elliott Wave Structure rest at 0.9191 of March 9th low while Relative Strength Index signals a bullish recoil higher for the pair.
Japanese Yen rebound may fizzle its way back to Safe-haven status
Chart posted on 14.04.2020

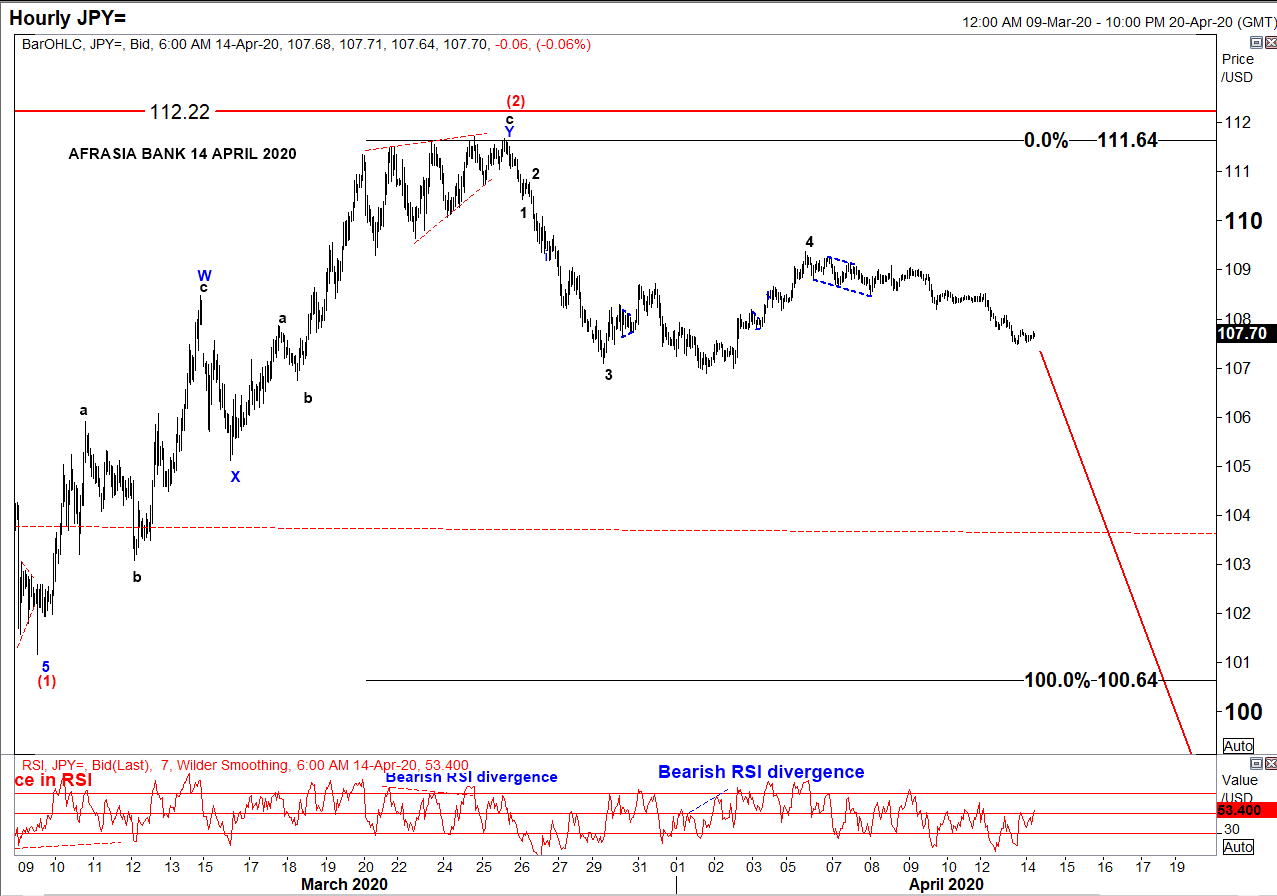
• After rallying to the downside from a high of 112.22 to 101.17 amid global pandemic threat, USD/JPY has been in a correcting mode since 9th March 2020 and seemed to have recently completed an W-X-Y Double Zig-Zag structure of Wave (2) reaching a high of 111.64 on 27th March 2020.
• Two strong indicators were flashing a trend reversal: ending diagonal at Wave 5 of Wave c and bearish RSI divergence.
• On the hourly chart, as per Elliott Wave analysis, the pair might resume its downwards trend targeting 100.64 - 93.78 to unfold Wave (3), a projection of 100%-161.8% of Fibonacci level.
• At 107.70 today, USD/JPY is percolating towards its target from 110.41 to 107.84, as per chart.
• On a side note, resumption of a bullish USD/JPY would mark an invalidation of the Elliott Wave structure above 112.22

Markey update on Biz Week by Christie Ng
Speak to our team
  • Allan Juste
    Head - Forex And Derivatives
    +230 5251 4855
  • Reshma Peerun Rajwani
    Head – Treasury Sales
    +230 403 5500
Disclaimer
Please note that the information published is purely indicative. It is based on technical data from sources which the Bank verily believes to be authentic, though its timeliness or accuracy cannot be warranted or guaranteed. AfrAsia Bank Ltd issues no invitation to anyone to rely on this bulletin and neither we nor our information providers shall be in no way whatsoever, liable for any errors or inaccuracies, regardless of cause, or the lack of timeliness, or for any delay or interruption in the transmission thereof to the user. The indicative rates and other market information are subject to changes at the Bank's discretion. Whilst every effort is made to ensure the information is accurate, you should confirm the latest situation with the Bank prior to making any decisions.