Internet Banking
Click icon again to close

Treasury

Daily Market Patrol

Market Patrol 7 May 2020

What we know is a drop, what we don't know is an ocean.
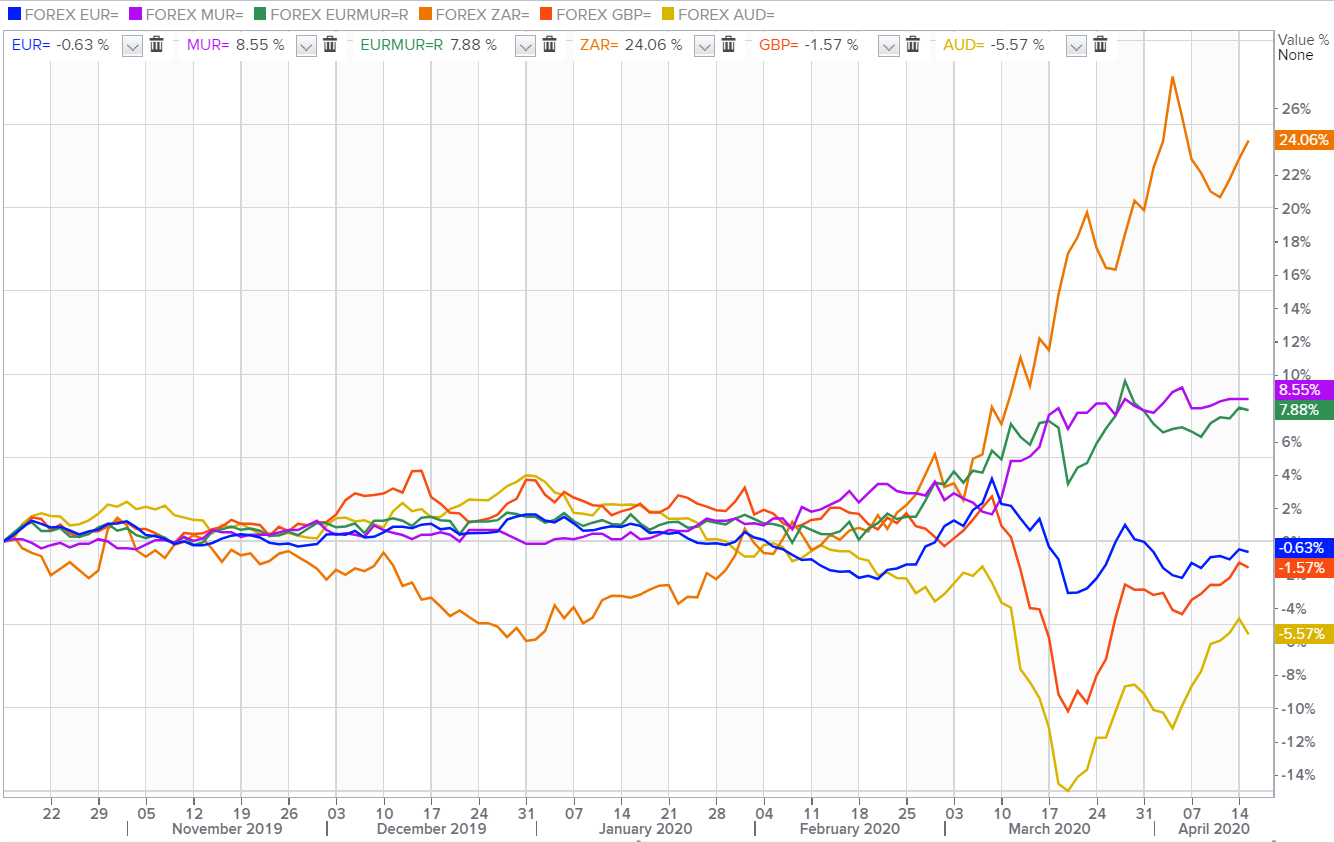
Isaac Newton
Indicative Selling Rates
against MUR
USD
19 Apr 2024
  • AUD
  • 30.42
  • 0.6459
  • BWP
  • 3.47
  • 0.0737
  • CAD
  • 34.46
  • 1.3664
  • CNY
  • 6.60
  • 7.1402
  • DKK
  • 6.82
  • 6.9093
  • EUR
  • 50.34
  • 1.0691
  • HKD
  • 6.10
  • 7.7148
  • INR
  • 0.57
  • 82.1874
  • JPY
  • 30.85
  • 152.6385
  • KES
  • 35.97
  • 130.9049
  • NZD
  • 27.96
  • 0.5937
  • NOK
  • 4.35
  • 10.8251
  • SGD
  • 34.91
  • 1.3490
  • ZAR
  • 2.53
  • 18.6446
  • SEK
  • 4.35
  • 10.8361
  • CHF
  • 52.18
  • 1.1081
  • GBP
  • 58.79
  • 1.2484
  • USD
  • 47.09
  • 1.0000
  • AED
  • 13.02
  • 3.6162
USD/MUR slashed by 25 cents to 40.45(selling) following Bank of Mauritius intervention yesterday.
Fundamental News

EUR/USD
The single plunged to a low of $1.0780 yesterday after weak EU retail sales suffered their largest decline on record in March while the German industry collapsed in production to -9.2%.


GBP/USD
The cable spiked from a low of $1.2308 to $1.2365 following the decision of the Bank of England to keep the interest decision put at 0.10%.


USD/JPY
The safe-haven yen soared to seven-week high at 105.98 per dollar on Thursday as investors limited their exposure to riskier assets amid dire global economic data, rising trade tensions and concerns over the eurozone.


AUD/USD
The Australian dollar edged up to $0.6442 on Thursday, helped by an unexpectedly large trade surplus for March on the back of mineral exports, but worries over weak consumption in top trading partner China capped gains.


USD/ZAR
The South African rand inched lower to 18.65 against the greenback after South African private sector activity fell to a record low in April, a business survey showed on Wednesday, as temporary company closures led to a collapse in demand.


USD/MUR
On the domestic market, the USD/MUR slashed by 25 cents to 40.45(selling) following BOM's intervention yesterday.


Fundamental & Technical Data
Economic Indicators-Local Time

10:00 - GBP - BoE Interest Rate Decision (May)

10:00 - EUR - German Industrial Production (MoM)(Mar)

15:00 - GBP - BoE Inflation Report

15:00 - GBP - BoE MPC Meeting Minutes

16:30 - USD - Initial Jobless Claims


Central Bank Interest Rates
Last Change
New Meeting
Federal Bank of U.S
0.00-0.25%
16-Mar-2020
10-Jun-2020
European Central Bank
0.00%
10-Mar-2016
04-Jun-2020
Bank of England
0.10%
19-May-2020
07-May-2020
Bank of Japan
-0.10%
28-Jan-2016
16-Jun-2020
Reserve Bank of Australia
0.25%
18-Mar-2020
05-May-2020
S.Africa Reserve Bank
4.25%
14-Apr-2020
21-May-2020
Reserve Bank of India
4.40%
27-Mar-2020
03-May-2020
Bank of Mauritius
1.85%
16-Apr-2020
-
Looking for Markets correlation?
Market Correlation is a measure, statistical or observational, that gives a positive or negative link between the pricing of multiple currencies.

Bulls & Bears Levels
Resistance and Support
Levels
EUR/USD
GBP/USD
USD/JPY
USD/ZAR
R3
1.0897
1.2533
107.14
19.54
R2
1.0871
1.2492
106.88
19.34
R1
1.0833
1.2418
106.50
19.17
PP
1.0808
1.2377
106.25
18.76
S1
1.0769
1.2303
105.87
18.58
S2
1.0744
1.2262
105.61
17.99
S3
1.0705
1.2188
105.23
17.81
Technical Analysis - Forex Charts
Safe-haven nature of FRANC SWISS may plummet USD/CHF to a downfall
Chart updated on 13.04.2020
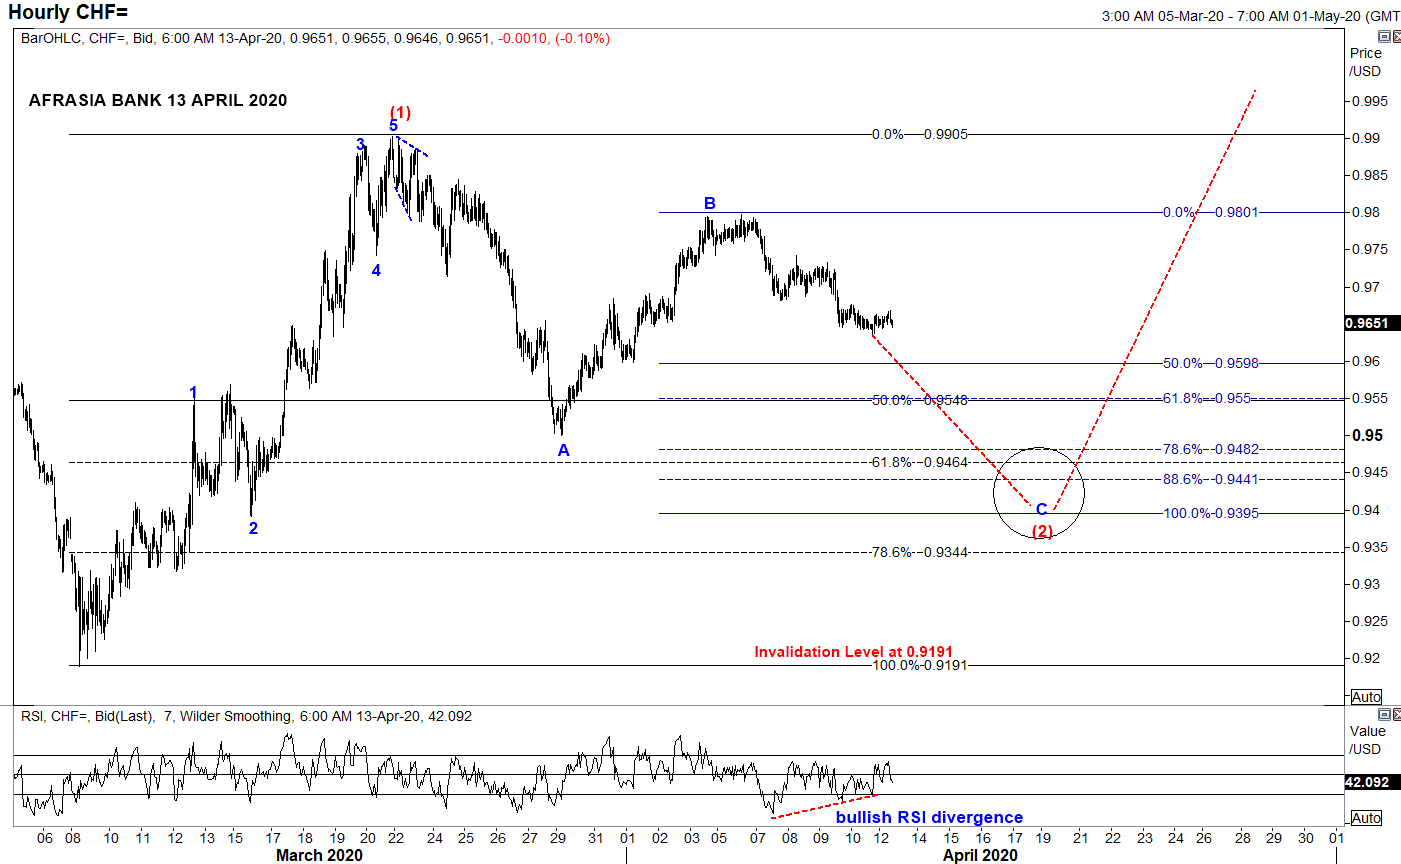
  • From an Elliott Wave standpoint, USDCHF could potentially unfold into compelling impulsive Wave C of the zigzag correction of Wave (2) to a narrowing region 0.9550 (50% retracement of Wave (1)) to 0.9395 (100% projection of Wave A through B) in the near term trend, from the downside bias from April 6th high of 0.9797.
  • Price could immediately start to shoot back up into Wave (3) on a longer perspective.
  • Piercing above the resistance 0.9905 would endorse the structure.
  • Alternatively, broader bearish invalidation of Elliott Wave Structure rest at 0.9191 of March 9th low while Relative Strength Index signals a bullish recoil higher for the pair.
Japanese Yen rebound may fizzle its way back to Safe-haven status
Chart posted on 14.04.2020

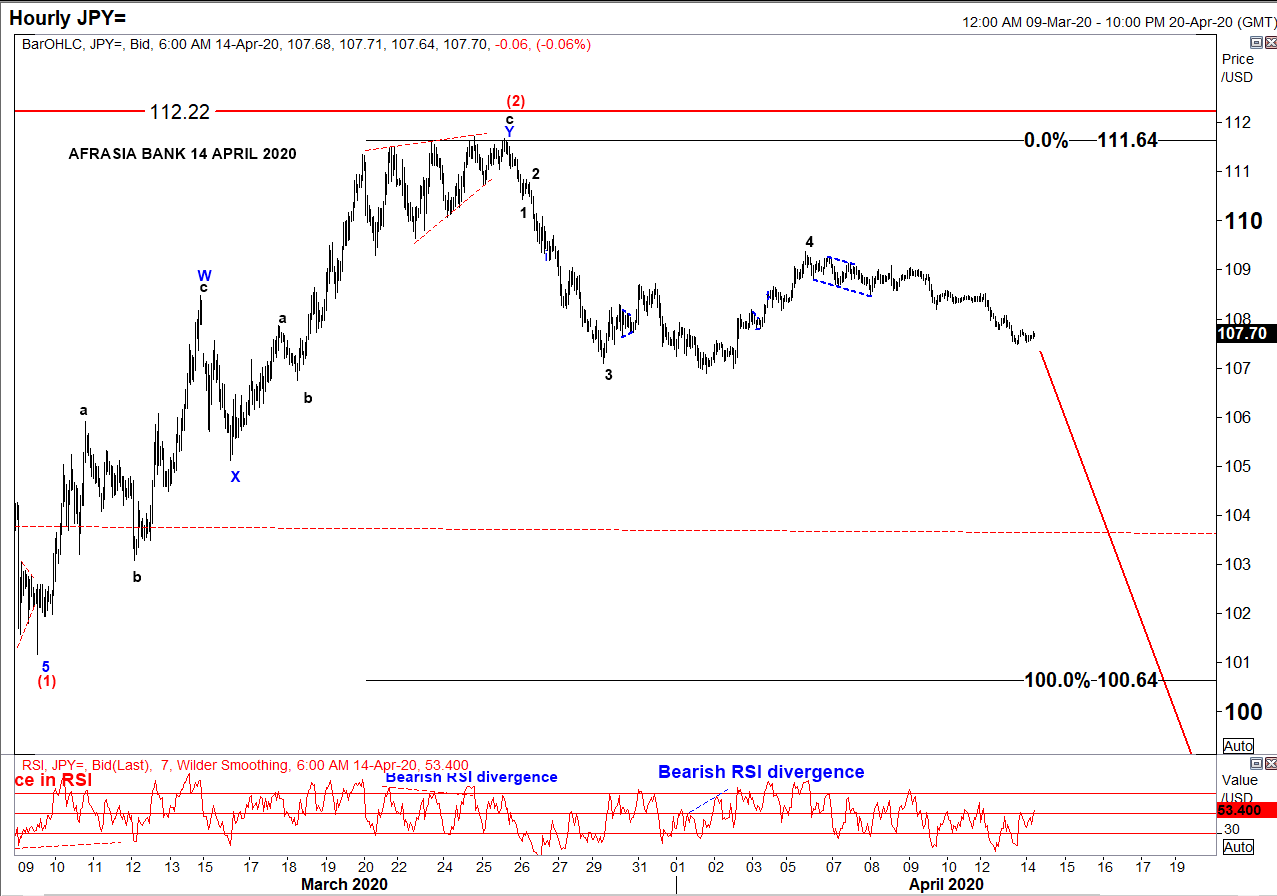
• After rallying to the downside from a high of 112.22 to 101.17 amid global pandemic threat, USD/JPY has been in a correcting mode since 9th March 2020 and seemed to have recently completed an W-X-Y Double Zig-Zag structure of Wave (2) reaching a high of 111.64 on 27th March 2020.
• Two strong indicators were flashing a trend reversal: ending diagonal at Wave 5 of Wave c and bearish RSI divergence.
• On the hourly chart, as per Elliott Wave analysis, the pair might resume its downwards trend targeting 100.64 - 93.78 to unfold Wave (3), a projection of 100%-161.8% of Fibonacci level.
• At 107.70 today, USD/JPY is percolating towards its target from 110.41 to 107.84, as per chart.
• On a side note, resumption of a bullish USD/JPY would mark an invalidation of the Elliott Wave structure above 112.22

Markey update on Biz Week by Christie Ng
Speak to our team
  • Allan Juste
    Head - Forex And Derivatives
    +230 5251 4855
  • Reshma Peerun Rajwani
    Head – Treasury Sales
    +230 403 5500
Disclaimer
Please note that the information published is purely indicative. It is based on technical data from sources which the Bank verily believes to be authentic, though its timeliness or accuracy cannot be warranted or guaranteed. AfrAsia Bank Ltd issues no invitation to anyone to rely on this bulletin and neither we nor our information providers shall be in no way whatsoever, liable for any errors or inaccuracies, regardless of cause, or the lack of timeliness, or for any delay or interruption in the transmission thereof to the user. The indicative rates and other market information are subject to changes at the Bank's discretion. Whilst every effort is made to ensure the information is accurate, you should confirm the latest situation with the Bank prior to making any decisions.