
Whatever the mind of man can conceive and believe, it can achieve.
USD
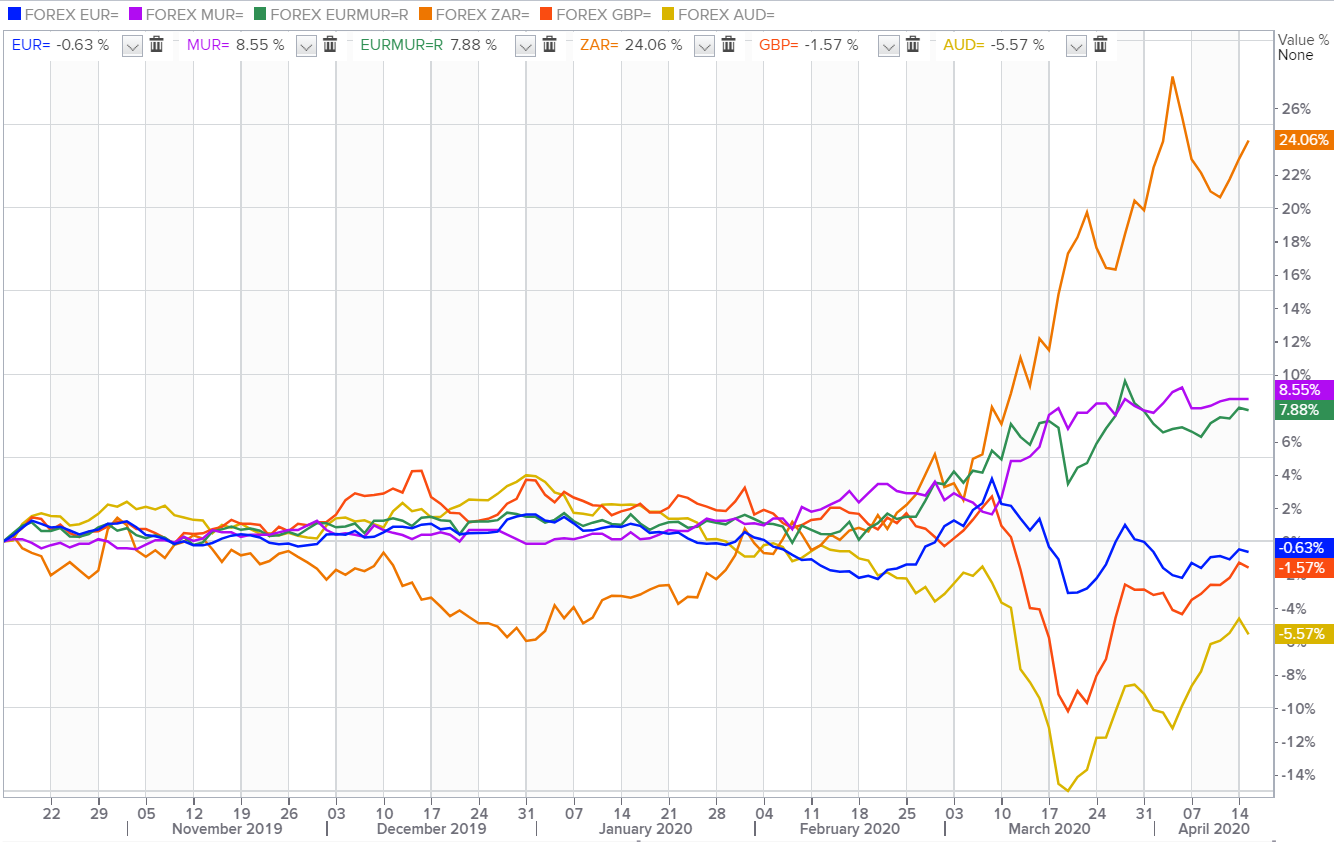
EUR/USD
The single currency tumbled to $1.0900 amid dismal EU Manufacturing PMI data and risk-off mode on Monday, while investors' will keep an eye on a ruling due today at noon regarding a court challenge from German academics to the European Central Bank’s bond-buying program.
GBP/USD
The cable consolidated at $1.2460, driven by the nervous sentiment before the UK-US trade talks and the final reading of British Services PMI for April.
USD/JPY
The yen escalated to 106.60 against the greenback amid a series of weak U.S. manufacturing activity numbers and rising tensions between the United States and China dented risk sentiment on Monday, while Japanese banks are off for Children's Day.
AUD/USD
The Australian dollar crept higher to $0.6450 benefiting from mood shift and after the Reserve Bank of Australia left interest rates on hold at record lows of 0.25% and recommitted to buy as much government debt as needed.
USD/ZAR
The South African rand surged to 18.45 per dollar but remained at the mercy of global risk sentiment in emerging countries.
USD/MUR
On the local Market, USD/MUR jumped by 20 cents to 40.50(selling), tracking a softer EUR/USD.
12:30 - GBP - Composite PMI (Apr)
12:30 - GBP - Construction PMI (Apr)
12:30 - GBP - Services PMI (Apr)
18:00 - USD - ISM Non-Manufacturing PMI (Apr)

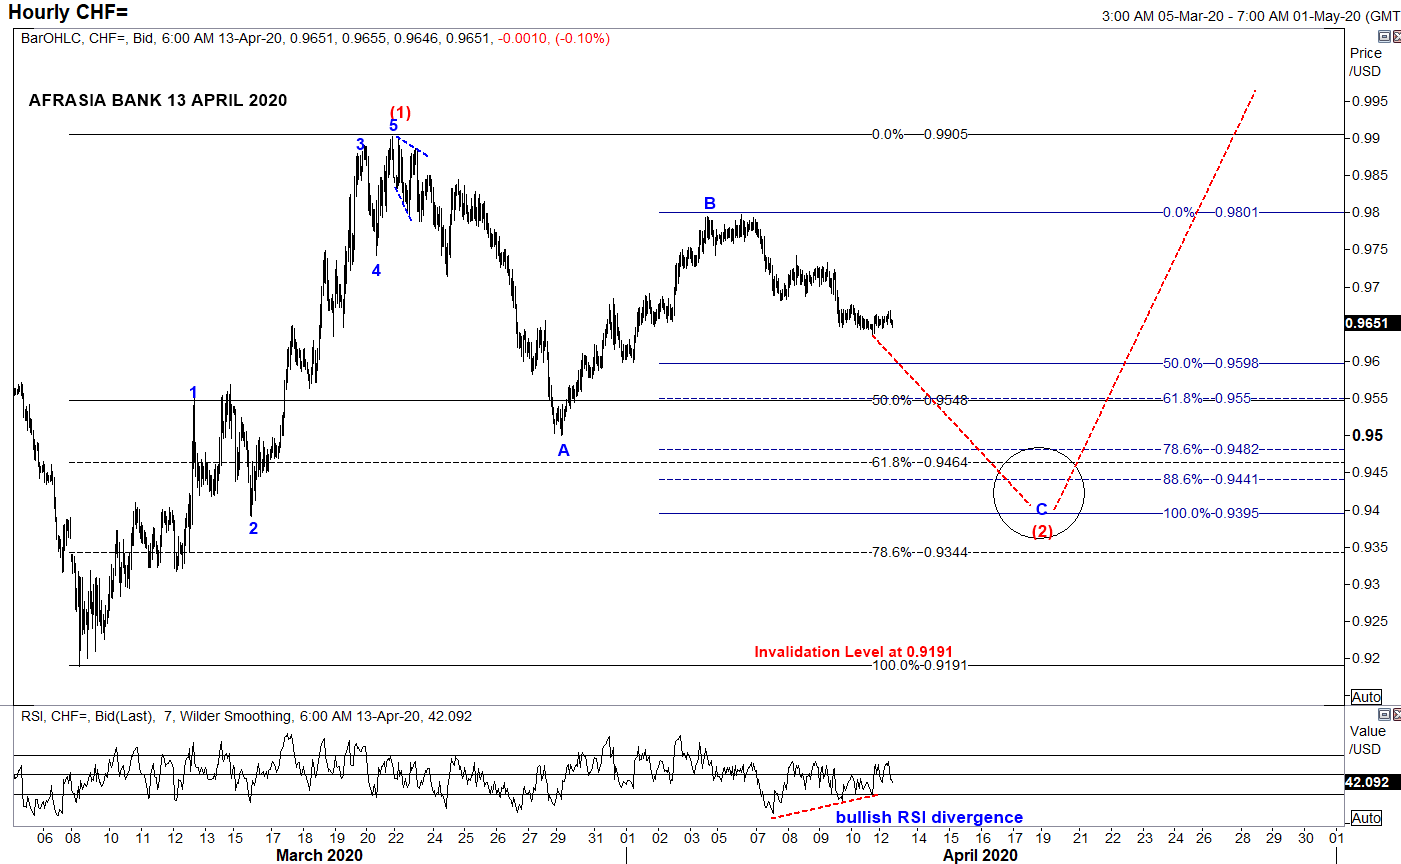
- From an Elliott Wave standpoint, USDCHF could potentially unfold into compelling impulsive Wave C of the zigzag correction of Wave (2) to a narrowing region 0.9550 (50% retracement of Wave (1)) to 0.9395 (100% projection of Wave A through B) in the near term trend, from the downside bias from April 6th high of 0.9797.
- Price could immediately start to shoot back up into Wave (3) on a longer perspective.
- Piercing above the resistance 0.9905 would endorse the structure.
- Alternatively, broader bearish invalidation of Elliott Wave Structure rest at 0.9191 of March 9th low while Relative Strength Index signals a bullish recoil higher for the pair.
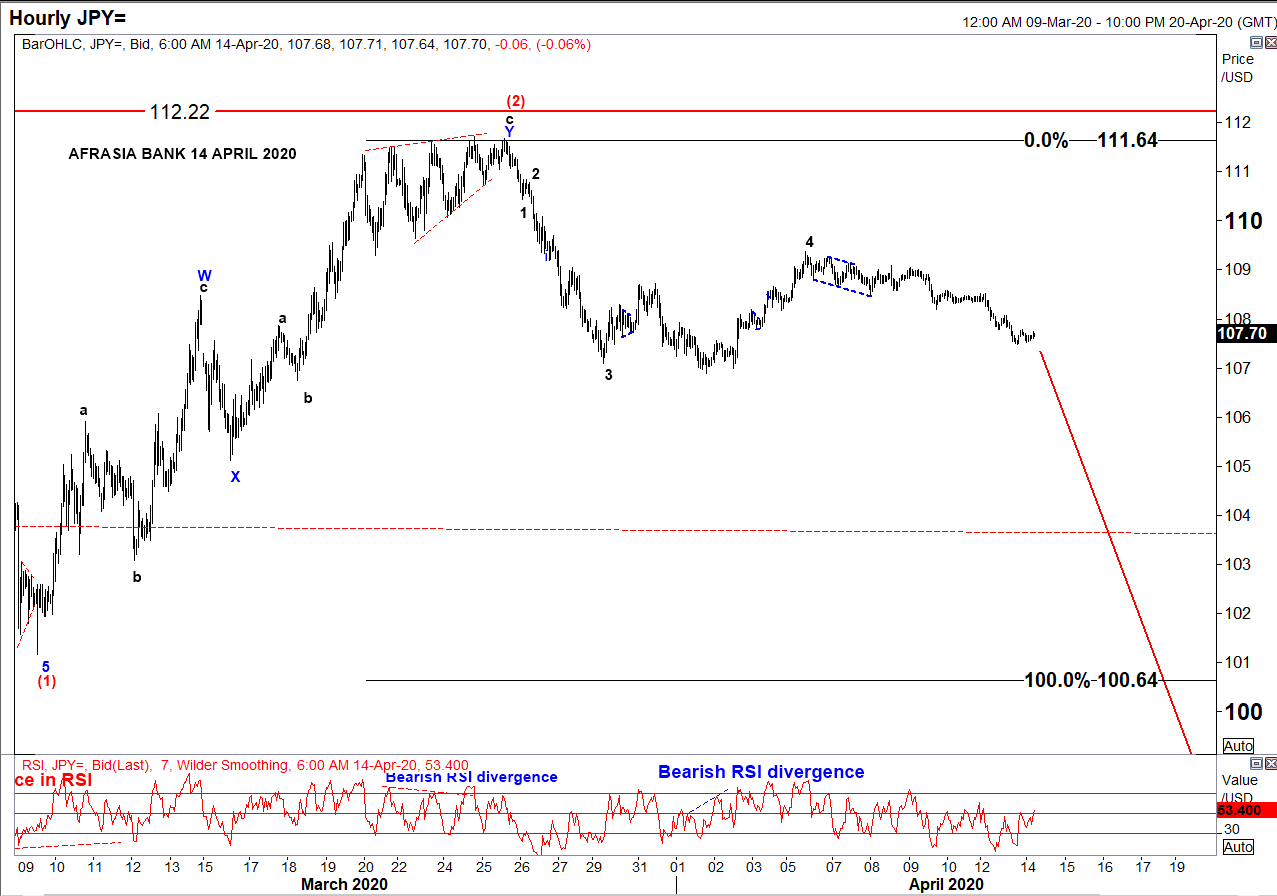
• After rallying to the downside from a high of 112.22 to 101.17 amid global pandemic threat, USD/JPY has been in a correcting mode since 9th March 2020 and seemed to have recently completed an W-X-Y Double Zig-Zag structure of Wave (2) reaching a high of 111.64 on 27th March 2020.
• Two strong indicators were flashing a trend reversal: ending diagonal at Wave 5 of Wave c and bearish RSI divergence.
• On the hourly chart, as per Elliott Wave analysis, the pair might resume its downwards trend targeting 100.64 - 93.78 to unfold Wave (3), a projection of 100%-161.8% of Fibonacci level.
• At 107.70 today, USD/JPY is percolating towards its target from 110.41 to 107.84, as per chart.
• On a side note, resumption of a bullish USD/JPY would mark an invalidation of the Elliott Wave structure above 112.22

