Internet Banking
Click icon again to close

Treasury

Daily Market Patrol

Market Patrol 4 May 2020

Earth is the one thing we all have in common. 
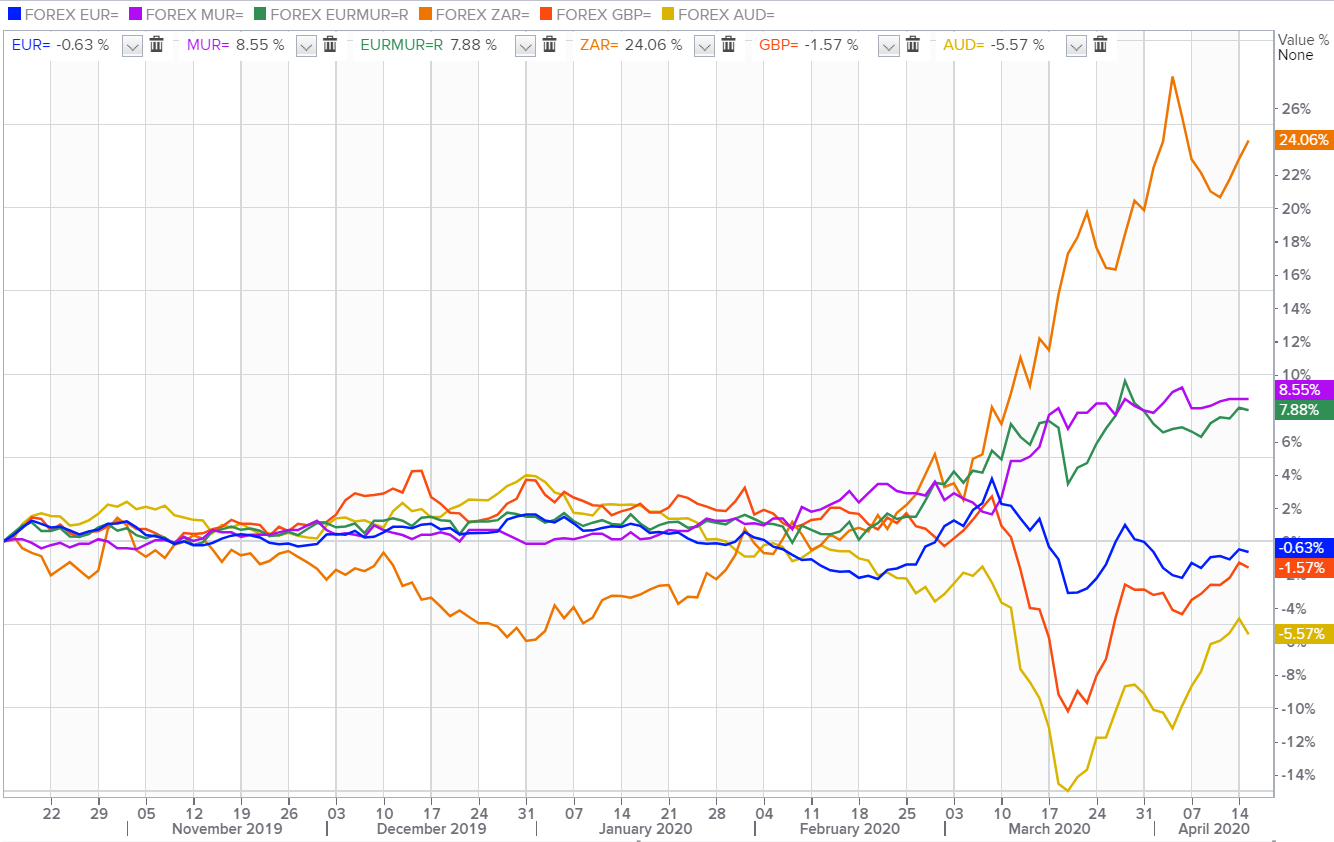
Jeff Bezos
Indicative Selling Rates
against MUR
USD
19 Apr 2024
  • AUD
  • 30.42
  • 0.6459
  • BWP
  • 3.47
  • 0.0737
  • CAD
  • 34.46
  • 1.3664
  • CNY
  • 6.60
  • 7.1402
  • DKK
  • 6.82
  • 6.9093
  • EUR
  • 50.34
  • 1.0691
  • HKD
  • 6.10
  • 7.7148
  • INR
  • 0.57
  • 82.1874
  • JPY
  • 30.85
  • 152.6385
  • KES
  • 35.97
  • 130.9049
  • NZD
  • 27.96
  • 0.5937
  • NOK
  • 4.35
  • 10.8251
  • SGD
  • 34.91
  • 1.3490
  • ZAR
  • 2.53
  • 18.6446
  • SEK
  • 4.35
  • 10.8361
  • CHF
  • 52.18
  • 1.1081
  • GBP
  • 58.79
  • 1.2484
  • USD
  • 47.09
  • 1.0000
  • AED
  • 13.02
  • 3.6162
USD/MUR plunged to Rs 40.30(Selling) post Bank of Mauritius's intervention on the domestic market
Fundamental News

EUR/USD
The single currency soared to of $1.1017 amid month-end dollar sell-off last Friday before retreating to $1.0940 on Monday as risk sentiment took a hit on rising US-China tensions.


GBP/USD
The cable cascaded from $1.2641 to $1.2424 as Brexit and virus updates weighed down the pair, amid market is eyeing for Bank of England interest rate decision this week.


USD/JPY
The yen mounted to 106.70 against the greenback on the report from U.S. Secretary of State Mike Pompeo on Sunday that there was "a significant amount of evidence" that the virus emerged from a Chinese laboratory.


AUD/USD
The Australian dollar plummeted to $0.6380 on comments from U.S. President Donald Trump on Friday that raising tariffs on China is "certainly an option" as he considers ways to retaliate for the spread of the coronavirus out of Wuhan, China.


USD/ZAR
The South African felt the pull of gravity to 18.92 per dollar as investors bracing for more bad news after dismal economic releases around the world signalled coming pain for developed and emerging economies.


USD/MUR
On the Domestic market, the U.S dollar edged back to 40.30(selling) against the Mauritian rupee after BOM’s intervention to sell USD 8 million to local banks last Thursday.


Fundamental & Technical Data
Economic Indicators-Local Time

11.55 - EUR - German Manufacturing PMI (Apr)

Central Bank Interest Rates
Last Change
New Meeting
Federal Bank of U.S
0.00-0.25%
16-Mar-2020
10-Jun-2020
European Central Bank
0.00%
10-Mar-2016
04-Jun-2020
Bank of England
0.10%
19-May-2020
07-May-2020
Bank of Japan
-0.10%
28-Jan-2016
16-Jun-2020
Reserve Bank of Australia
0.25%
18-Mar-2020
05-May-2020
S.Africa Reserve Bank
4.25%
14-Apr-2020
21-May-2020
Reserve Bank of India
4.40%
27-Mar-2020
03-May-2020
Bank of Mauritius
1.85%
16-Apr-2020
-
Looking for Markets correlation?
Market Correlation is a measure, statistical or observational, that gives a positive or negative link between the pricing of multiple currencies.

Bulls & Bears Levels
Resistance and Support
Levels
EUR/USD
GBP/USD
USD/JPY
USD/ZAR
R3
1.1106
1.2693
108.14
19.54
R2
1.1063
1.2647
107.77
19.34
R1
1.1022
1.2575
107.34
19.17
PP
1.0978
1.2529
106.94
18.76
S1
1.0938
1.2458
106.54
18.58
S2
1.0894
1.2412
106.17
17.99
S3
1.0853
1.2340
105.74
17.81
Technical Analysis - Forex Charts
Safe-haven nature of FRANC SWISS may plummet USD/CHF to a downfall
Chart updated on 13.04.2020
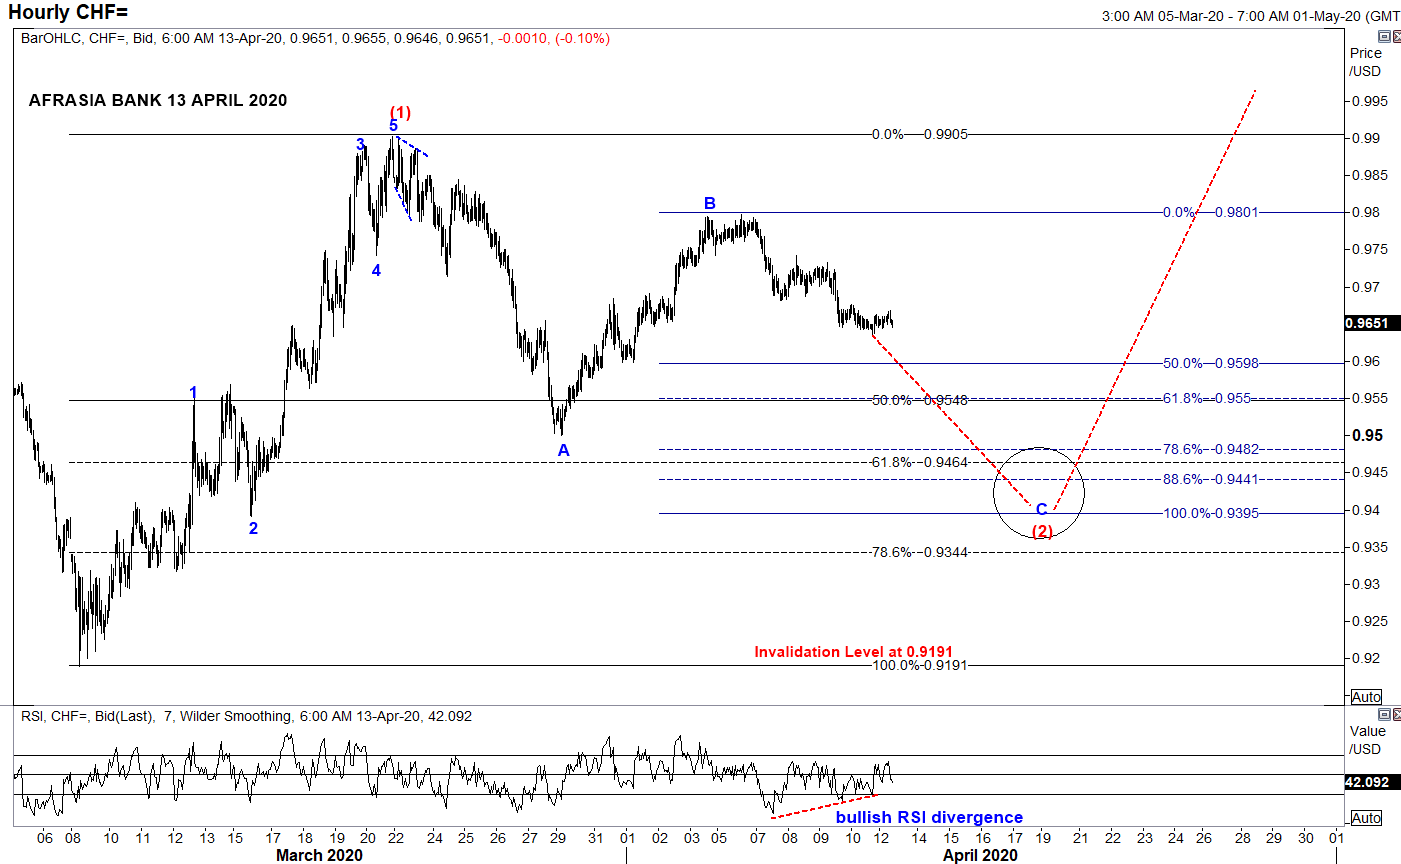
  • From an Elliott Wave standpoint, USDCHF could potentially unfold into compelling impulsive Wave C of the zigzag correction of Wave (2) to a narrowing region 0.9550 (50% retracement of Wave (1)) to 0.9395 (100% projection of Wave A through B) in the near term trend, from the downside bias from April 6th high of 0.9797.
  • Price could immediately start to shoot back up into Wave (3) on a longer perspective.
  • Piercing above the resistance 0.9905 would endorse the structure.
  • Alternatively, broader bearish invalidation of Elliott Wave Structure rest at 0.9191 of March 9th low while Relative Strength Index signals a bullish recoil higher for the pair.
Japanese Yen rebound may fizzle its way back to Safe-haven status
Chart posted on 14.04.2020

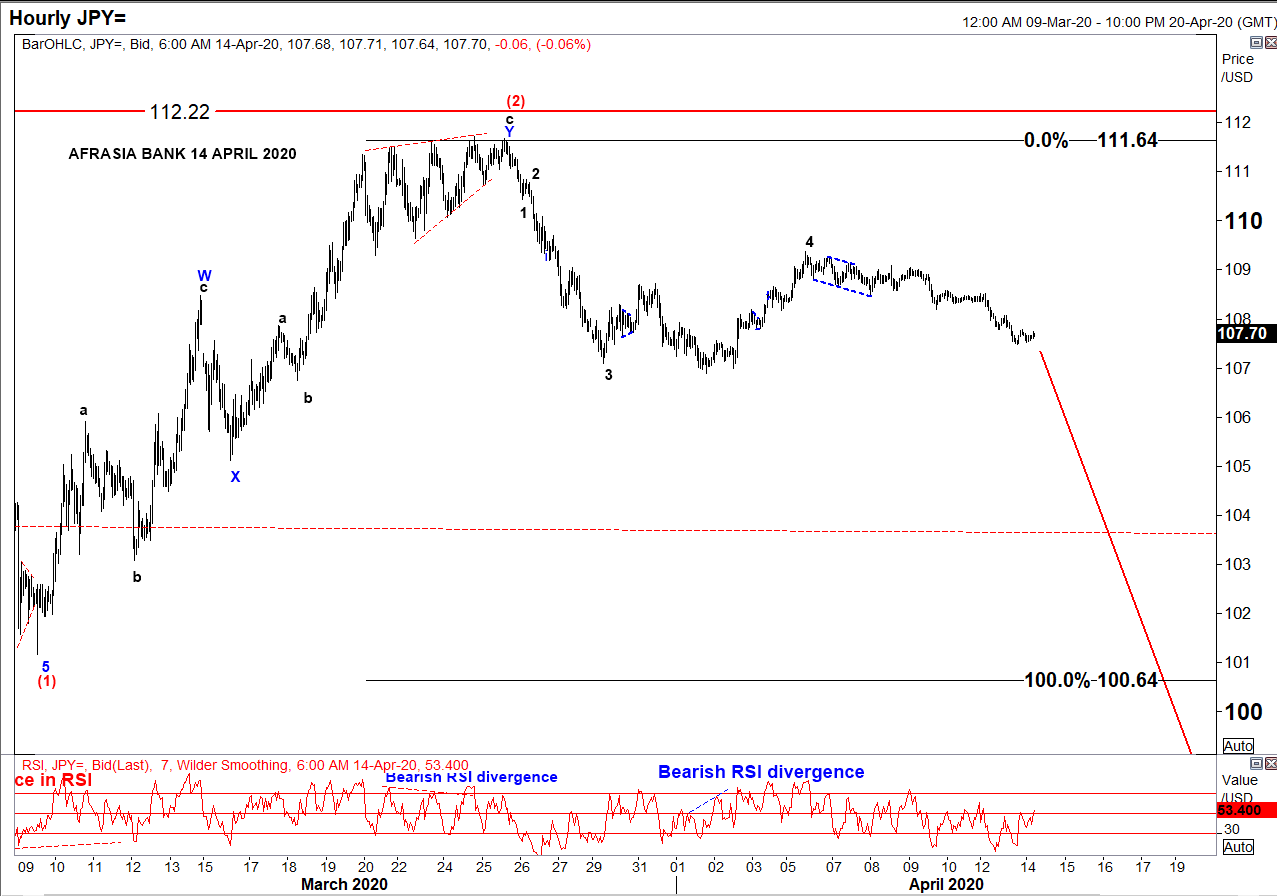
• After rallying to the downside from a high of 112.22 to 101.17 amid global pandemic threat, USD/JPY has been in a correcting mode since 9th March 2020 and seemed to have recently completed an W-X-Y Double Zig-Zag structure of Wave (2) reaching a high of 111.64 on 27th March 2020.
• Two strong indicators were flashing a trend reversal: ending diagonal at Wave 5 of Wave c and bearish RSI divergence.
• On the hourly chart, as per Elliott Wave analysis, the pair might resume its downwards trend targeting 100.64 - 93.78 to unfold Wave (3), a projection of 100%-161.8% of Fibonacci level.
• At 107.70 today, USD/JPY is percolating towards its target from 110.41 to 107.84, as per chart.
• On a side note, resumption of a bullish USD/JPY would mark an invalidation of the Elliott Wave structure above 112.22

Markey update on Biz Week by Christie Ng
Speak to our team
  • Allan Juste
    Head - Forex And Derivatives
    +230 5251 4855
  • Reshma Peerun Rajwani
    Head – Treasury Sales
    +230 403 5500
Disclaimer
Please note that the information published is purely indicative. It is based on technical data from sources which the Bank verily believes to be authentic, though its timeliness or accuracy cannot be warranted or guaranteed. AfrAsia Bank Ltd issues no invitation to anyone to rely on this bulletin and neither we nor our information providers shall be in no way whatsoever, liable for any errors or inaccuracies, regardless of cause, or the lack of timeliness, or for any delay or interruption in the transmission thereof to the user. The indicative rates and other market information are subject to changes at the Bank's discretion. Whilst every effort is made to ensure the information is accurate, you should confirm the latest situation with the Bank prior to making any decisions.