Internet Banking
Click icon again to close

Treasury

Daily Market Patrol

Market Patrol 25 May 2020

Being a smart businessperson, being a good capitalist, means adapting to addressing the situation you face.
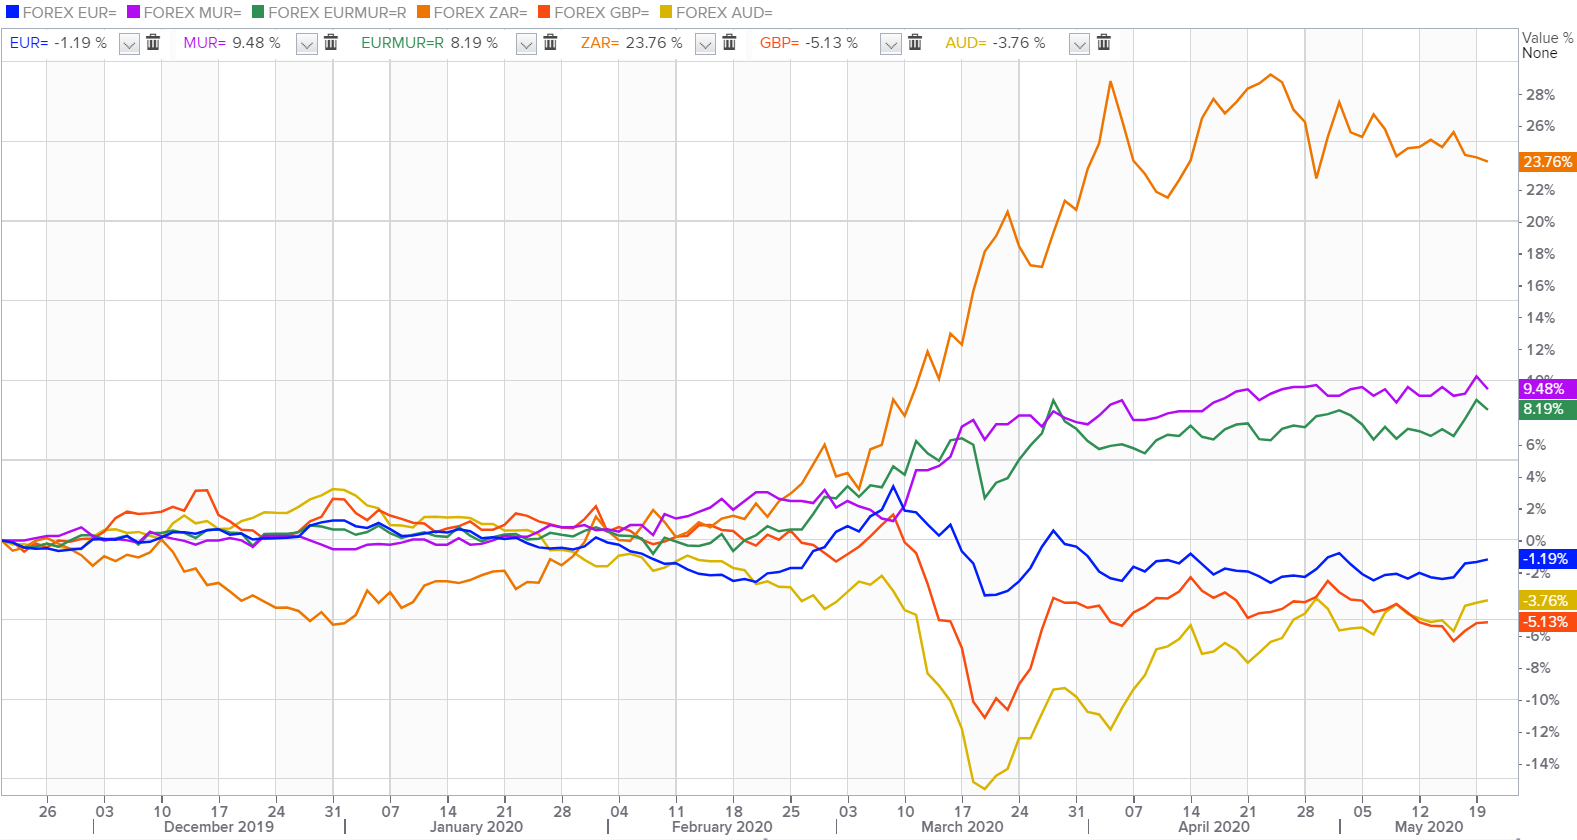
Mark Cuban
Indicative Selling Rates
against MUR
USD
19 Apr 2024
  • AUD
  • 30.42
  • 0.6459
  • BWP
  • 3.47
  • 0.0737
  • CAD
  • 34.46
  • 1.3664
  • CNY
  • 6.60
  • 7.1402
  • DKK
  • 6.82
  • 6.9093
  • EUR
  • 50.34
  • 1.0691
  • HKD
  • 6.10
  • 7.7148
  • INR
  • 0.57
  • 82.1874
  • JPY
  • 30.85
  • 152.6385
  • KES
  • 35.97
  • 130.9049
  • NZD
  • 27.96
  • 0.5937
  • NOK
  • 4.35
  • 10.8251
  • SGD
  • 34.91
  • 1.3490
  • ZAR
  • 2.53
  • 18.6446
  • SEK
  • 4.35
  • 10.8361
  • CHF
  • 52.18
  • 1.1081
  • GBP
  • 58.79
  • 1.2484
  • USD
  • 47.09
  • 1.0000
  • AED
  • 13.02
  • 3.6162
The U.S dollar edged higher on Monday as worries about a standoff between the United States and China over civil liberties in Hong Kong fuelled demand for safe-haven currencies.
Fundamental News

EUR/USD
The Single currency slipped to $1.0890 on Monday amid the broad-based demand for the American dollar, while German IFO expectations Index (May) is scheduled for release at noon.


GBP/USD 
Sterling caught a breather near $1.2190 amid a lack of major catalysts on Spring Bank Holiday. The Pound likely to be on defensive after members of British Prime Minister Boris Johnson's party called for the resignation of an influential aide, Dominic Cummings for breaking travel restrictions during the coronavirus lockdown.


USD/JPY
The Yen recovered to 107.65 per dollar although news of Japan’s likely removes of state of emergency from Tokyo and nearness to another aid packages which seemed to probe the risk-off sentiment.


AUD/USD
The Australian dollar gave up early gains to trade at $0.6535 as risk aversion offset optimism about the country's emergence from coronavirus lockdowns.


USD/ZAR
South Africa's rand strengthened to 17.55 against the greenback despite the emergence of a fresh source of tension between the United States and China after Beijing moved to impose a new security law on Hong Kong hurt demand for currencies seen as higher risk.


USD/MUR

On the domestic market, the USD/MUR edged higher by 15 cents to 40.45(selling), tracking a bullish U.S dollar across the board.

Fundamental & Technical Data
Economic Indicators-Local Time

10:00 - EUR - German GDP (QoQ)(Q1)

12:00 - EUR - German Ifo Business Climate Index (May)

21:30 - CAD - BoC Gov Poloz Speaks


Central Bank Interest Rates
Last Change
New Meeting
Federal Bank of U.S
0.00-0.25%
16-Mar-2020
10-Jun-2020
European Central Bank
0.00%
10-Mar-2016
04-Jun-2020
Bank of England
0.10%
19-May-2020
18-Jun-2020
Bank of Japan
-0.10%
28-Jan-2016
16-Jun-2020
Reserve Bank of Australia
0.25%
18-Mar-2020
02-Jun-2020
S.Africa Reserve Bank
4.25%
21-May-2020
-
Reserve Bank of India
4.00%
22-May-2020
-
Bank of Mauritius
1.85%
16-Apr-2020
-
Looking for Markets correlation?
Market Correlation is a measure, statistical or observational, that gives a positive or negative link between the pricing of multiple currencies.

Bulls & Bears Levels
Resistance and Support
Levels
EUR/USD
GBP/USD
USD/JPY
USD/ZAR
R3
1.1010
1.2290
108.27
18.40
R2
1.0982
1.2262
108.01
18.00
R1
1.0942
1.2218
107.83
17.81
PP
1.0914
1.2190
107.57
17.50
S1
1.0874
1.2146
107.39
17.23
S2
1.0846
1.2118
107.13
16.58
S3
1.0806
1.2074
106.95
15.92
Technical Analysis - Forex Charts
Safe-haven nature of FRANC SWISS may plummet USD/CHF to a downfall
Chart updated on 13.04.2020
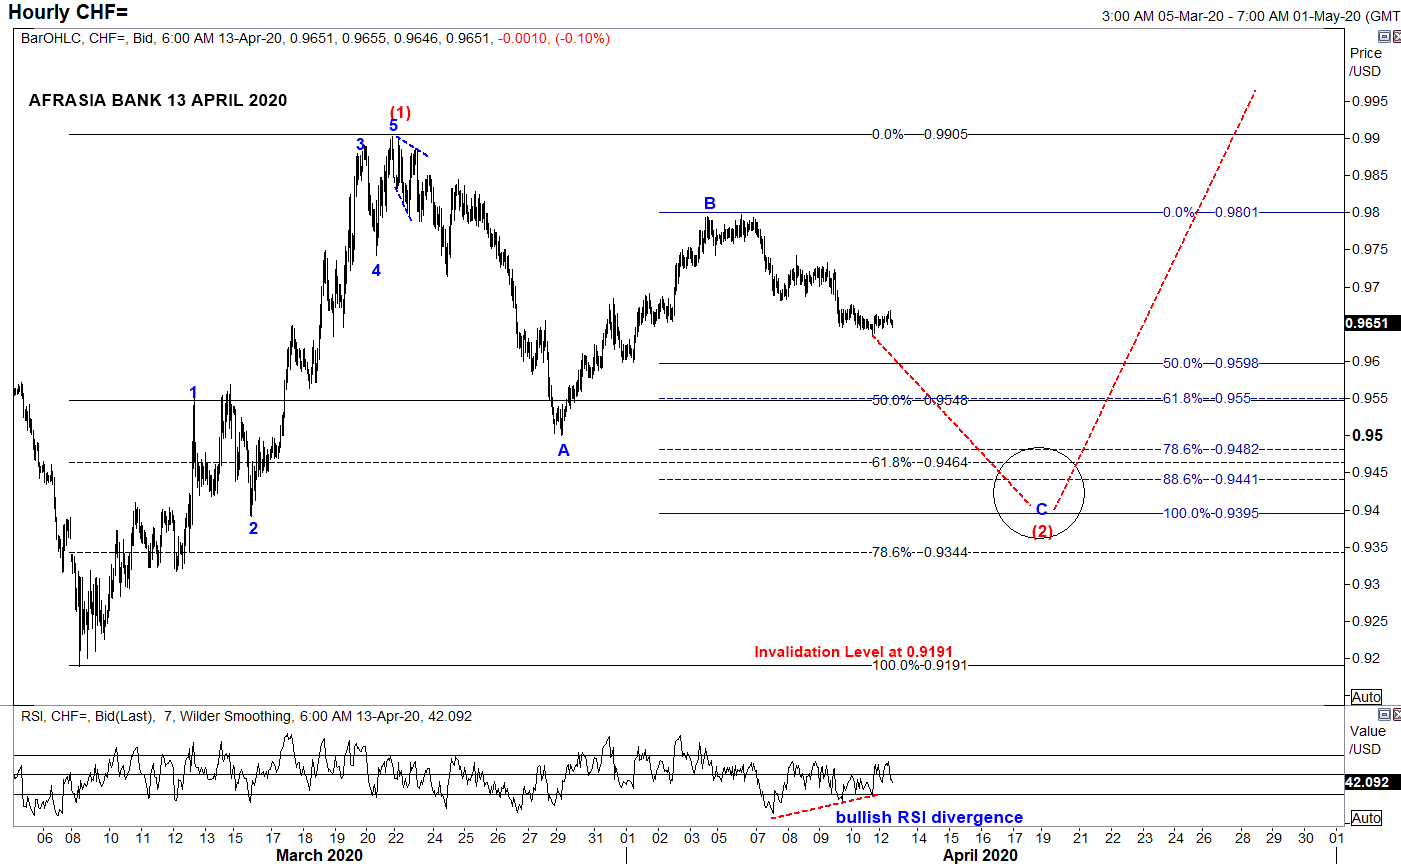
  • From an Elliott Wave standpoint, USDCHF could potentially unfold into compelling impulsive Wave C of the zigzag correction of Wave (2) to a narrowing region 0.9550 (50% retracement of Wave (1)) to 0.9395 (100% projection of Wave A through B) in the near term trend, from the downside bias from April 6th high of 0.9797.
  • Price could immediately start to shoot back up into Wave (3) on a longer perspective.
  • Piercing above the resistance 0.9905 would endorse the structure.
  • Alternatively, broader bearish invalidation of Elliott Wave Structure rest at 0.9191 of March 9th low while Relative Strength Index signals a bullish recoil higher for the pair.
Japanese Yen rebound may fizzle its way back to Safe-haven status
Chart posted on 14.04.2020

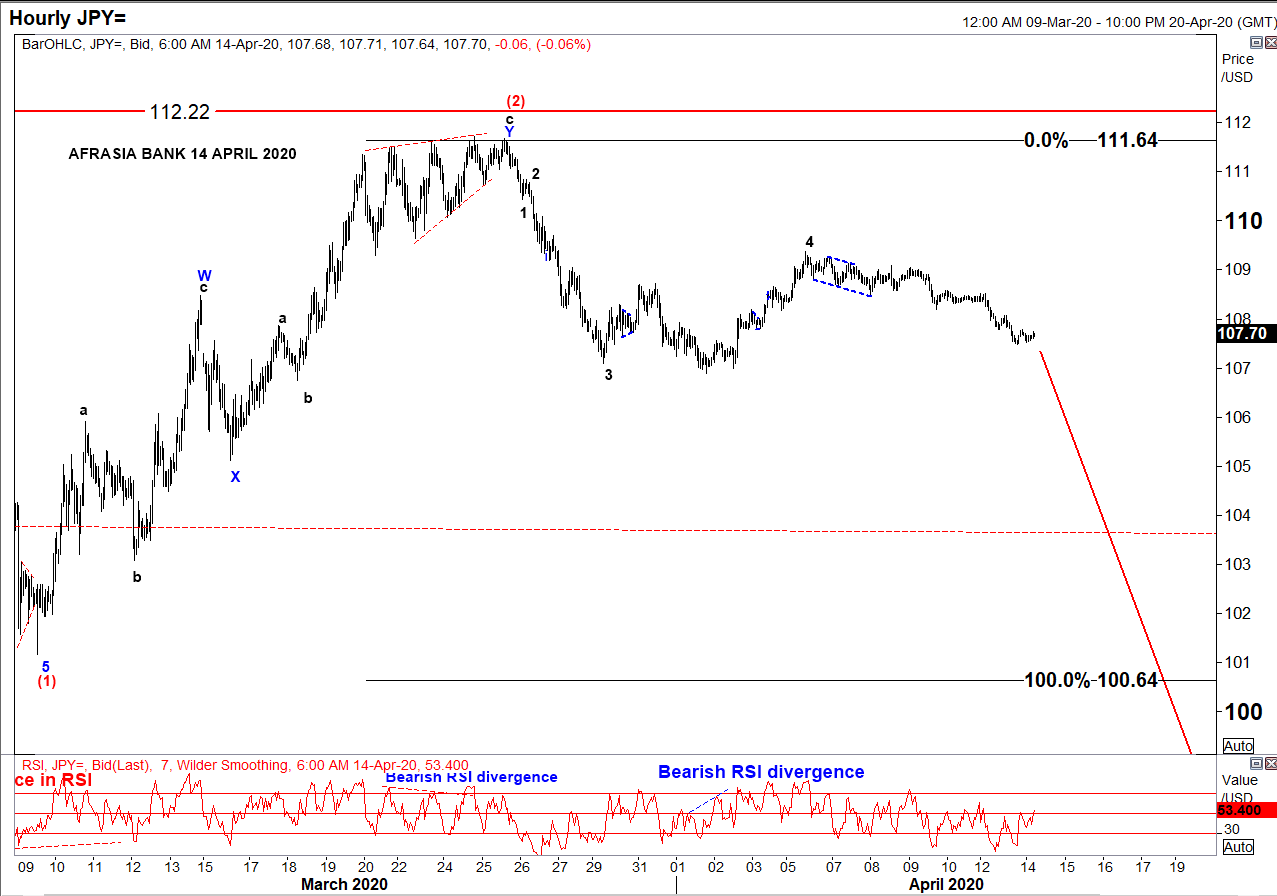
• After rallying to the downside from a high of 112.22 to 101.17 amid global pandemic threat, USD/JPY has been in a correcting mode since 9th March 2020 and seemed to have recently completed an W-X-Y Double Zig-Zag structure of Wave (2) reaching a high of 111.64 on 27th March 2020.
• Two strong indicators were flashing a trend reversal: ending diagonal at Wave 5 of Wave c and bearish RSI divergence.
• On the hourly chart, as per Elliott Wave analysis, the pair might resume its downwards trend targeting 100.64 - 93.78 to unfold Wave (3), a projection of 100%-161.8% of Fibonacci level.
• At 107.70 today, USD/JPY is percolating towards its target from 110.41 to 107.84, as per chart.
• On a side note, resumption of a bullish USD/JPY would mark an invalidation of the Elliott Wave structure above 112.22

Markey update on Biz Week by Christie Ng
Speak to our team
  • Allan Juste
    Head - Forex And Derivatives
    +230 5251 4855
  • Reshma Peerun Rajwani
    Head – Treasury Sales
    +230 403 5500
Disclaimer
Please note that the information published is purely indicative. It is based on technical data from sources which the Bank verily believes to be authentic, though its timeliness or accuracy cannot be warranted or guaranteed. AfrAsia Bank Ltd issues no invitation to anyone to rely on this bulletin and neither we nor our information providers shall be in no way whatsoever, liable for any errors or inaccuracies, regardless of cause, or the lack of timeliness, or for any delay or interruption in the transmission thereof to the user. The indicative rates and other market information are subject to changes at the Bank's discretion. Whilst every effort is made to ensure the information is accurate, you should confirm the latest situation with the Bank prior to making any decisions.