
To every action there is always opposed an equal reaction.
USD
EUR/USD
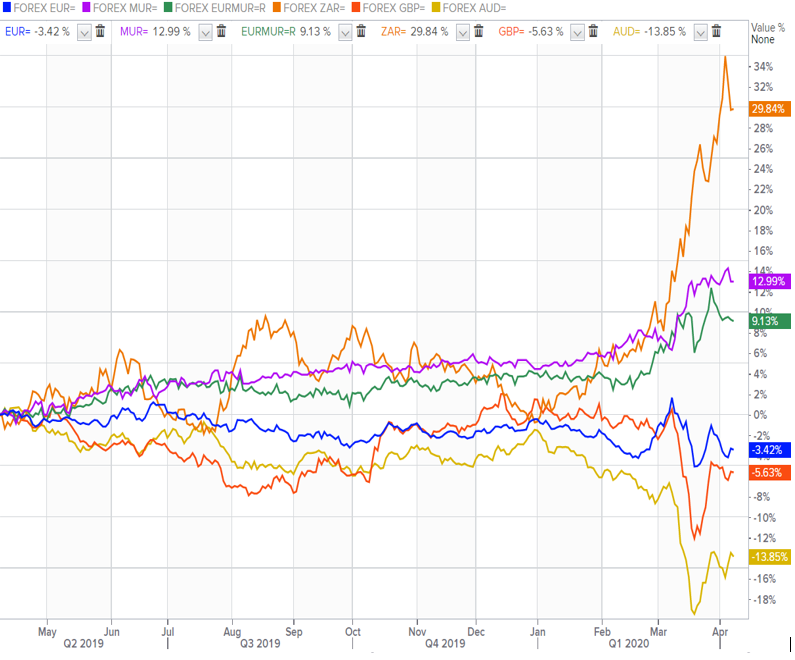
The shared currency mounted to $1.0945 amid broad-based dollar weakness dwarfed by the $2.3 trillion monetary and fiscal stimulus from the Fed and U.S government last week.
GBP/USD
The Cable cherished upside momentum to $1.2569 UK’s Deputized leader Raab signalled one more month of lockdown while NHS Providers cited lack of medical supplies stemming from Coronavirus outbreak.
USD/JPY
The safe-haven yen surged to 107.70 against the US dollar on reports that the International Monetary Fund would furnish immediate debt service relief to 25 member countries under its Catastrophe Containment and Relief Trust to enable them accessing scarce resources on fighting the coronavirus pandemic.
AUD/USD
The Aussie bolstered to $0.6432 on Chinese Trade Balance data for March, reporting a bigger-than-feared increase in the trade surplus and above-forecasts exports and imports data, that helped boost the sentiment in Asia this Tuesday.
USD/ZAR
The South African's seesawed around 18 against the greenback as national lockdown continues in a bid to curtail the spread of Covid-19.
USD/MUR
The pair vaulted by 20 cents to Rs39.95/USD (selling), following the Bank of Mauritius' Intervention to sell dollars at Rs39.50 on the domestic market.

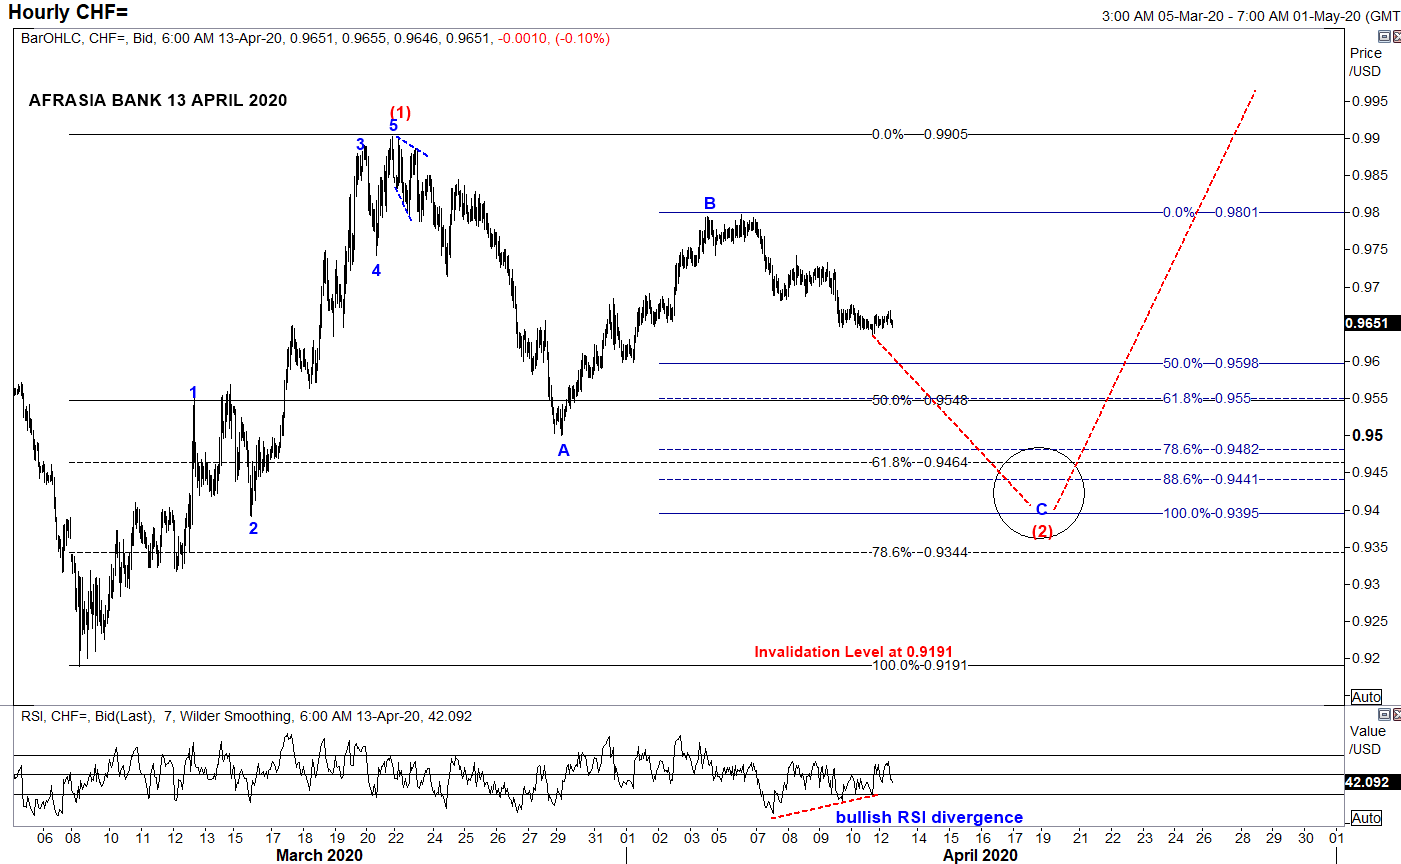
- From an Elliott Wave standpoint, USDCHF could potentially unfold into compelling impulsive Wave C of the zigzag correction of Wave (2) to a narrowing region 0.9550 (50% retracement of Wave (1)) to 0.9395 (100% projection of Wave A through B) in the near term trend, from the downside bias from April 6th high of 0.9797.
- Price could immediately start to shoot back up into Wave (3) on a longer perspective.
- Piercing above the resistance 0.9905 would endorse the structure.Alternatively, broader bearish invalidation of Elliott Wave Structure rest at 0.9191 of March 9th low while Relative Strength Index signals a bullish recoil higher for the pair.
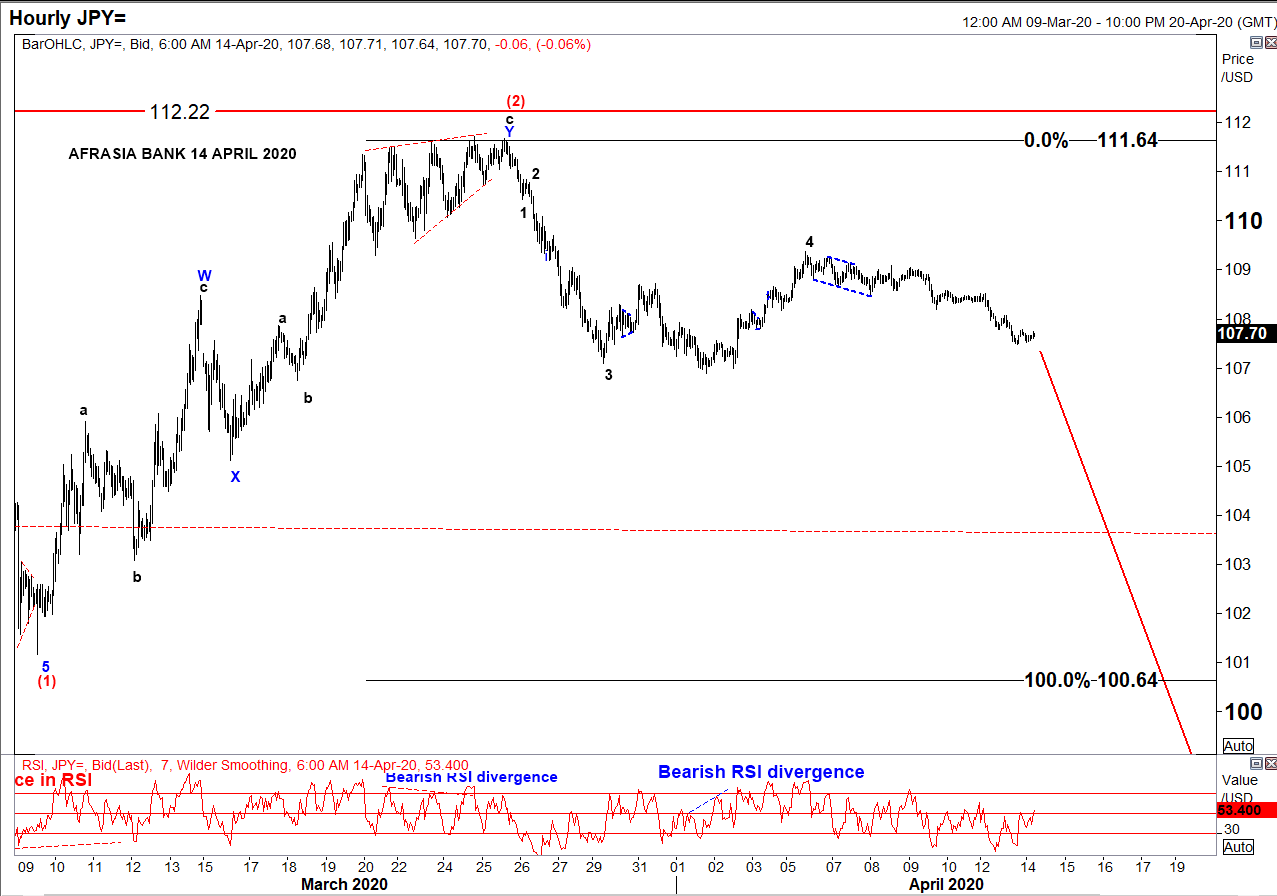
• After rallying to the downside from a high of 112.22 to 101.17 amid global pandemic threat, USD/JPY has been in a correcting mode since 9th March 2020 and seemed to have recently completed an W-X-Y Double Zig-Zag structure of Wave (2) reaching a high of 111.64 on 27th March 2020.
• Two strong indicators were flashing a trend reversal: ending diagonal at Wave 5 of Wave c and bearish RSI divergence.
• On the hourly chart, as per Elliott Wave analysis, the pair might resume its downwards trend targeting 100.64 - 93.78 to unfold Wave (3), a projection of 100%-161.8% of Fibonacci level.
• At 107.70 today, USD/JPY is percolating towards its target from 110.41 to 107.84, as per chart.
• On a side note, resumption of a bullish USD/JPY would mark an invalidation of the Elliott Wave structure above 112.22
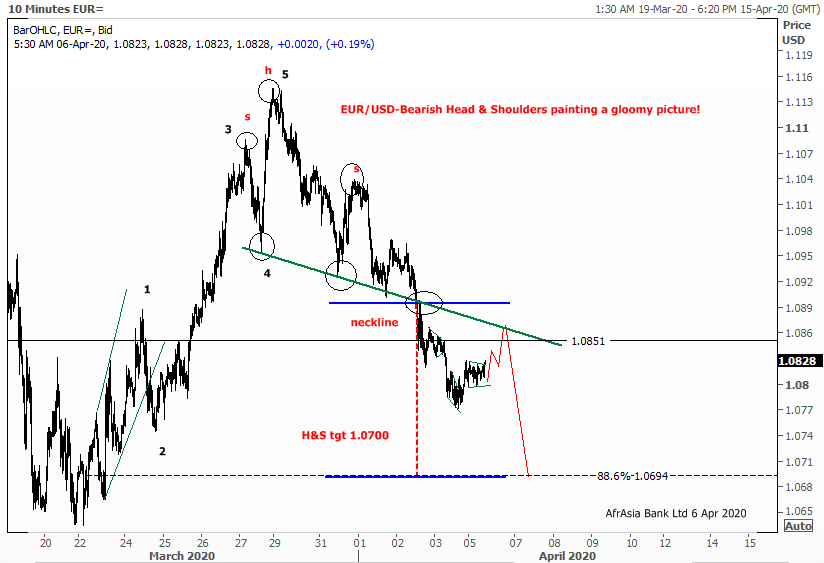
The Single currency plunged to a low of $1.0771 last week, before trimming back some losses to $1.0825 this morning, as safe-haven demand boosted the U.S dollar higher across the board. On a technical perspective, the EUR/USD appears to be tracking the bearish Head & Shoulders (H&S)pattern highlighted last week.
The H & S neckline, as illustrated on the 10 mins chart, could possibly act as magnet in the coming sessions that would propel the EUR/USD higher near $1.0850/75.
- However, the pair still remain vulnerable to further downside possible near $1.0700( H &S target level).

