Internet Banking
Click icon again to close

Treasury

Daily Market Patrol

Market Patrol 13 April 2020

I know where I’m getting out before I get in.

Bruce Kovner
Indicative Selling Rates
against MUR
USD
25 Apr 2024
  • AUD
  • 30.77
  • 0.6565
  • BWP
  • 3.43
  • 0.0733
  • CAD
  • 34.51
  • 1.3581
  • CNY
  • 6.56
  • 7.1473
  • DKK
  • 6.83
  • 6.8649
  • EUR
  • 50.42
  • 1.0758
  • HKD
  • 6.08
  • 7.7125
  • INR
  • 0.57
  • 82.0612
  • JPY
  • 30.50
  • 153.6760
  • KES
  • 35.48
  • 132.1115
  • NZD
  • 28.10
  • 0.5994
  • NOK
  • 4.36
  • 10.7536
  • SGD
  • 34.80
  • 1.3468
  • ZAR
  • 2.52
  • 18.6007
  • SEK
  • 4.37
  • 10.7251
  • CHF
  • 51.57
  • 1.1003
  • GBP
  • 58.71
  • 1.2526
  • USD
  • 46.87
  • 1.0000
  • AED
  • 12.96
  • 3.6157
USD/MUR opened flat this morning, tracking thinned holiday trading across the markets
Fundamental News

EUR/USD
The shared currency consolidated near $1.0949 in early Asian session as China reported the highest number of new daily cases in nearly six weeks and fueled fears about the second wave of COVID-19 outbreak.


GBP/USD
The Cable spiked to $1.2505 after Prime Minister Boris Johnson left the hospital for treatment of COVID-19, the illness caused by the coronavirus.


USD/JPY
The safe-haven yen rallied to 107.80 per dollar amid coronavirus-led risk-off US dollar pullback.


AUD/USD
The Aussie sidelined at $0.6345 as investors shunned risky trades while waiting for Tuesday’s Chinese trade data to provide fresh clues.


USD/ZAR
The South African's rand firmed at 18.07 against the greenback despite its economy remained gloomy amid Covid-19.


USD/MUR
The pair stayed put at Rs39.75/USD(selling) on the domestic market, tracking thinned holiday trading amid Easter Monday.

Fundamental & Technical Data
Economic Indicators-Local Time
Looking for Markets correlation?
Market Correlation is a measure, statistical or observational, that gives a positive or negative link between the pricing of multiple currencies.

Bulls & Bears Levels
Technical Analysis - Forex Charts
USD/JPY at 108.94 now, morphing its way to claim back its safe-haven title
Chart updated on 07.04.2020

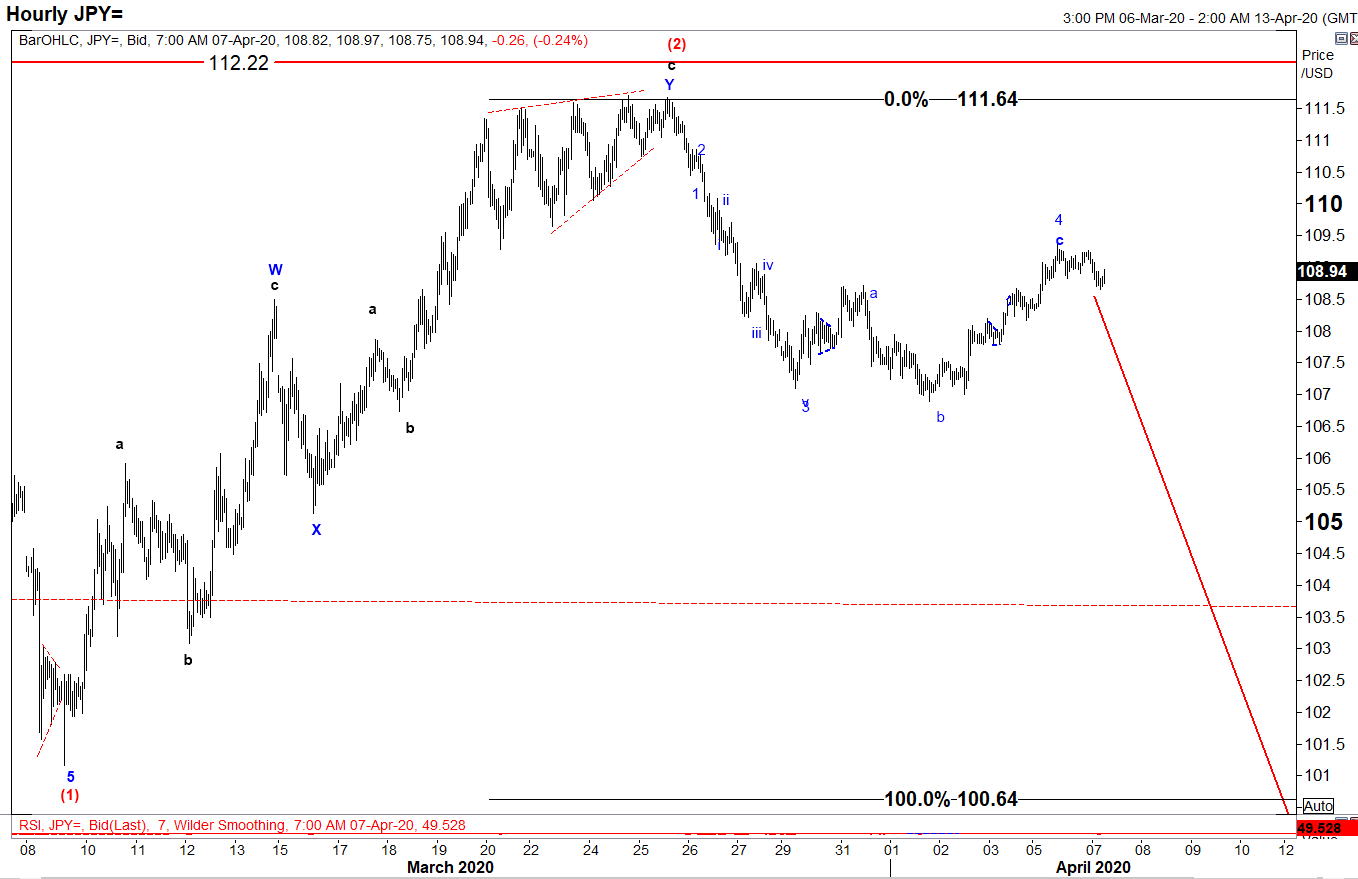
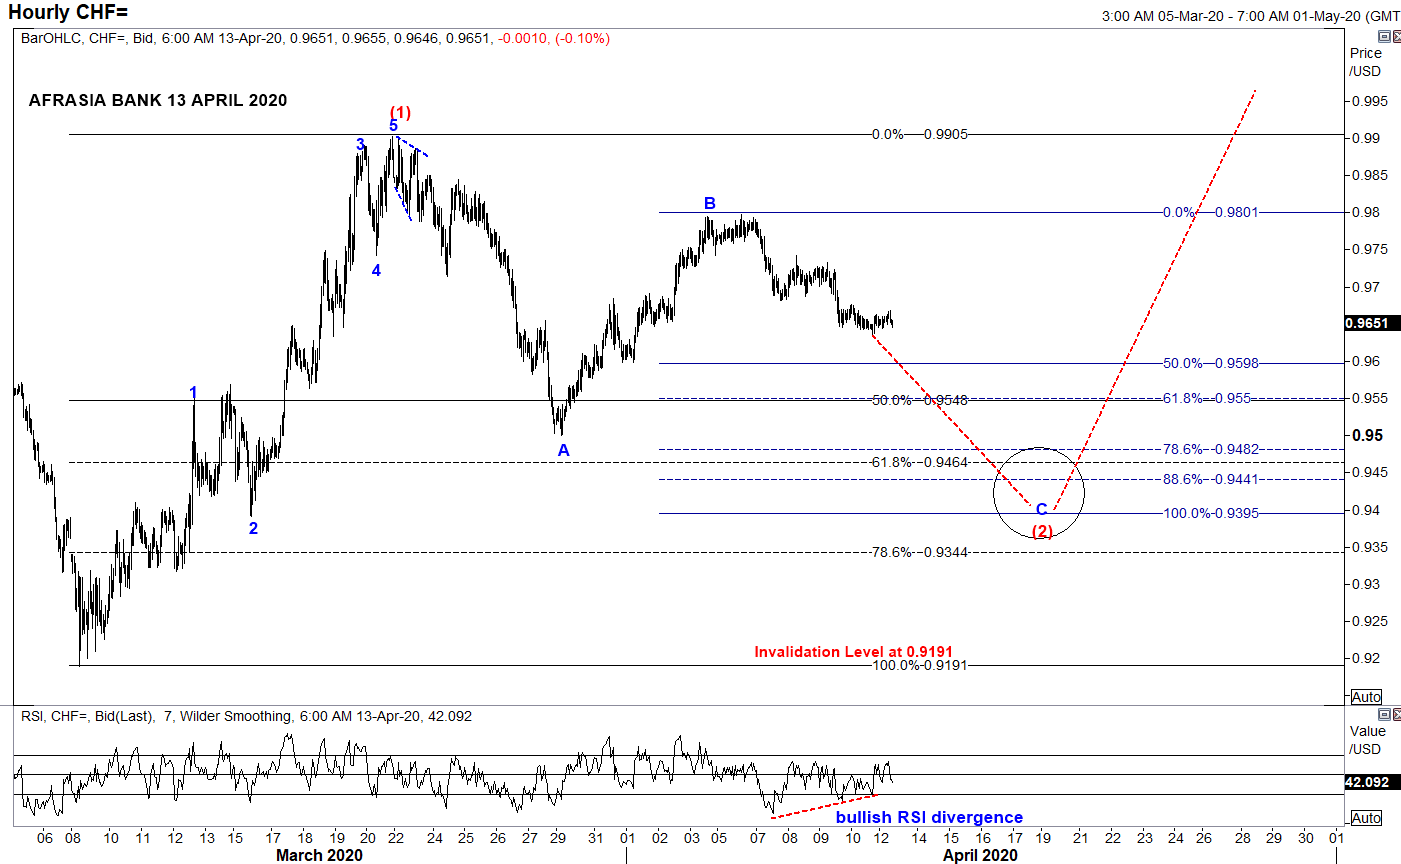
• After rallying to the downside from a high of 112.22 to 101.17 amid global pandemic threat, USD/JPY has been in a correcting mode since 9th March 2020 and seemed to have recently completed an W-X-Y Double Zig-Zag structure of Wave (2) reaching a high of 111.64 on 27th March 2020.
• Two strong indicators were flashing a trend reversal: ending diagonal at Wave 5 of Wave c and bearish RSI divergence.
• On the hourly chart, as per Elliott Wave analysis, the pair might resume its downwards trend targeting 100.64 - 93.78 to unfold Wave (3), a projection of 100%-161.8% of Fibonacci level.
• USD/JPY is percolating towards its target from 110.41 to 107.84, as per chart below.
• On a side note, resumption of a bullish USD/JPY would mark an invalidation of the Elliott Wave structure above 112.22

Snapshot EUR/USD - Tracking the bearish Head & Shoulders pattern!
Chart posted on 06.04.2020

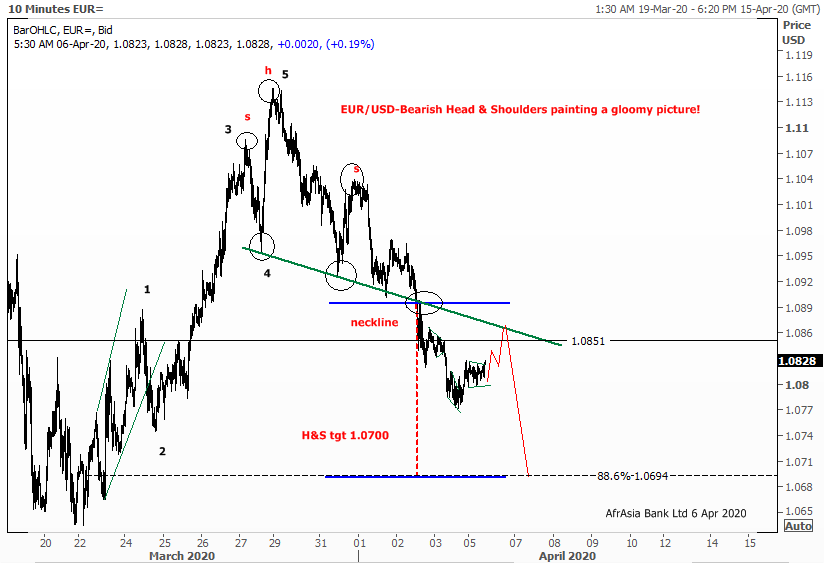
The Single currency plunged to a low of $1.0771 last week, before trimming back some losses to $1.0825 this morning, as safe-haven demand boosted the U.S dollar higher across the board.

On a technical perspective, the EUR/USD appears to be tracking the bearish Head & Shoulders (H&S)pattern highlighted last week.

The H & S neckline, as illustrated on the 10 mins chart, could possibly act as magnet in the coming sessions that would propel the EUR/USD higher near $1.0850/75.

However, the pair still remain vulnerable to further downside possible near $1.0700 (H &S target level).

Elliott Wave Analysis: Safe-haven nature of FRANC SWISS may plummet USD/CHF to a downfall.
Chart posted on 13.04.2020
• From an Elliott Wave standpoint, USD/CHF could potentially unfold into compelling impulsive Wave C of the zigzag correction of Wave (2) to a narrowing region 0.9550 (50% retracement of Wave (1)) to 0.9395 (100% projection of Wave A through B) in the near term trend, from the downside bias from April 6th high of 0.9797. • Price could immediately start to shoot back up into Wave (3) on a longer perspective. Piercing above the resistance 0.9905 would endorse the structure.
Markey update on Biz Week by Christie Ng
Speak to our team
  • Allan Juste
    Head - Forex And Derivatives
    +230 5251 4855
  • Reshma Peerun Rajwani
    Head – Treasury Sales
    +230 403 5500
Disclaimer
Please note that the information published is purely indicative. It is based on technical data from sources which the Bank verily believes to be authentic, though its timeliness or accuracy cannot be warranted or guaranteed. AfrAsia Bank Ltd issues no invitation to anyone to rely on this bulletin and neither we nor our information providers shall be in no way whatsoever, liable for any errors or inaccuracies, regardless of cause, or the lack of timeliness, or for any delay or interruption in the transmission thereof to the user. The indicative rates and other market information are subject to changes at the Bank's discretion. Whilst every effort is made to ensure the information is accurate, you should confirm the latest situation with the Bank prior to making any decisions.