Internet Banking
Click icon again to close

Treasury

Daily Market Patrol

Market Patrol 30 April 2026

There is only one success -- to be able to spend your life in your own way. 

Christopher Morley
Indicative Selling Rates
against MUR
USD
30 Apr 2026
  • AUD
  • 35.29
  • 0.7433
  • BWP
  • 3.77
  • 0.0795
  • CAD
  • 36.35
  • 1.3063
  • CNY
  • 7.37
  • 6.4417
  • DKK
  • 7.76
  • 6.1203
  • EUR
  • 55.63
  • 1.1716
  • HKD
  • 6.28
  • 7.5607
  • INR
  • 0.53
  • 90.1865
  • JPY
  • 31.18
  • 152.2916
  • KES
  • 38.13
  • 124.5290
  • NZD
  • 28.97
  • 0.6102
  • NOK
  • 5.29
  • 8.9683
  • SGD
  • 38.44
  • 1.2351
  • ZAR
  • 2.97
  • 15.9653
  • SEK
  • 5.33
  • 8.9131
  • CHF
  • 62.19
  • 1.3099
  • GBP
  • 64.23
  • 1.3528
  • USD
  • 47.48
  • 1.0000
  • AED
  • 13.46
  • 3.5275
The Euro remained under slight pressure ahead of the ECB meeting this afternoon, where policymakers are expected to keep rates unchanged today.
Fundamental News

EUR/USD

The Euro remained under slight pressure at $1.1655 ahead of the ECB meeting this afternoon, where policymakers are expected to keep rates unchanged today while signaling a likely hike in June as energy-driven inflation continues.

GBP/USD

The Pound Sterling slipped to $1.3460 as sentiment stayed fragile, with rising energy-driven inflation and recession risks linked to the Iran conflict weighing on the outlook, while the BoE is widely expected to keep rates on hold this afternoon. 
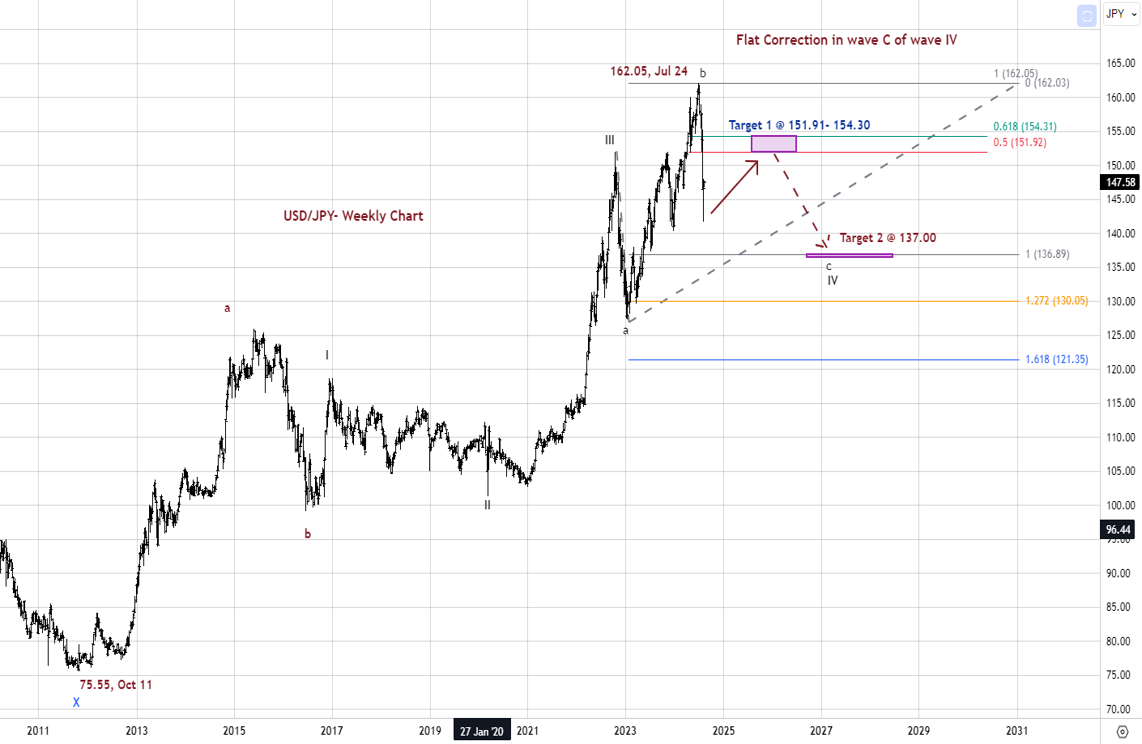
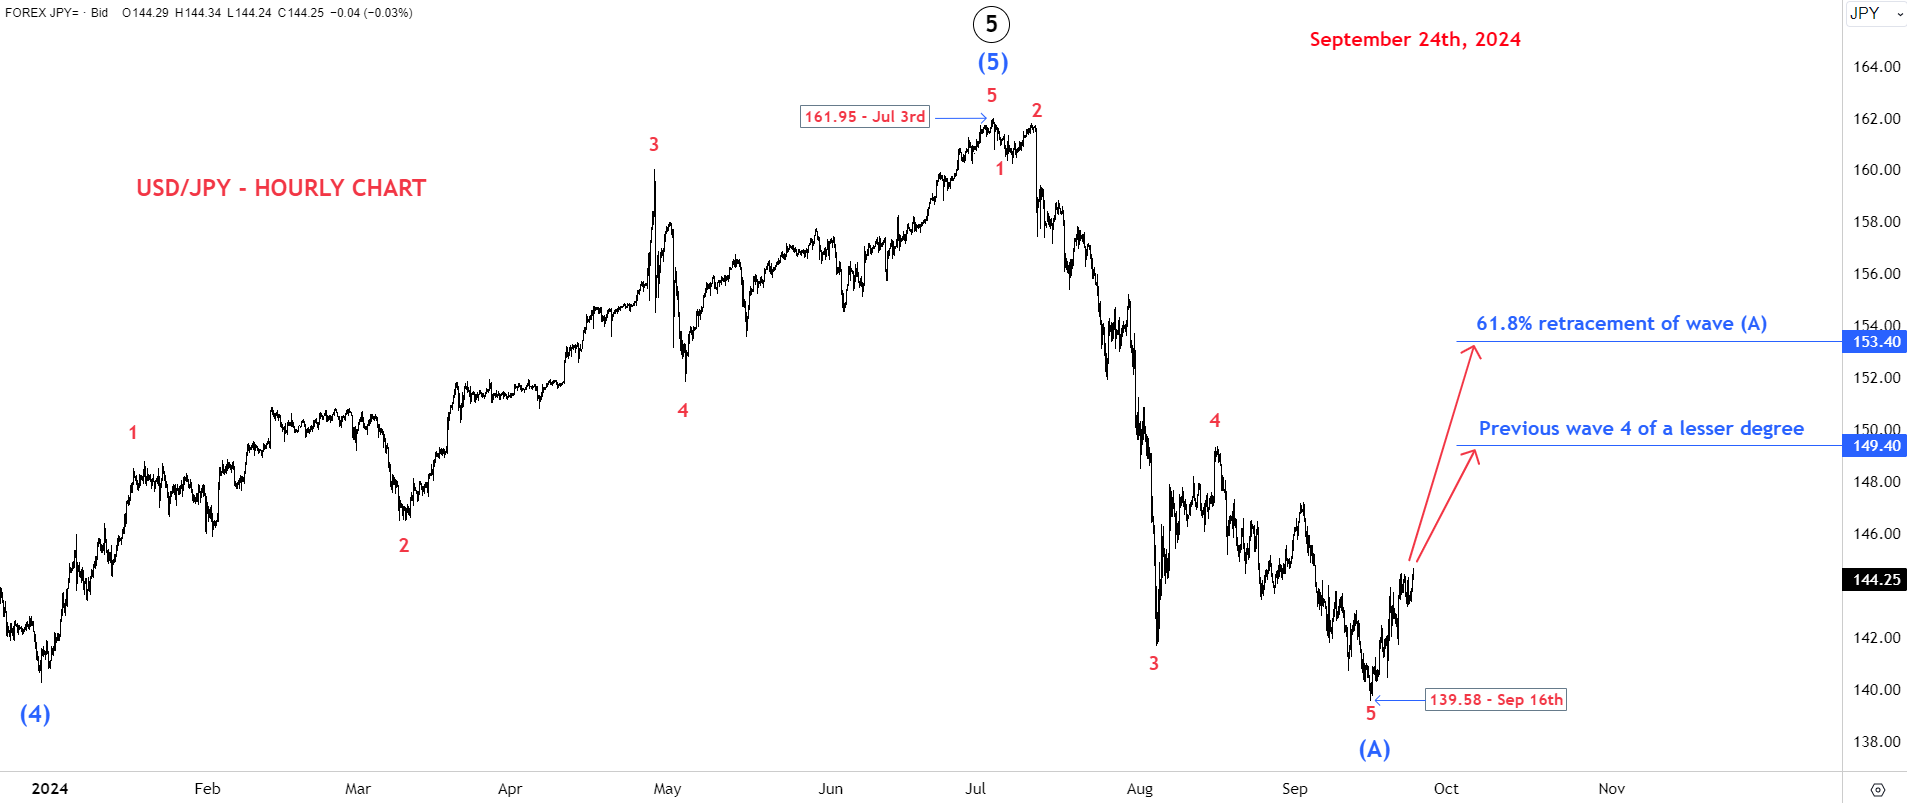
USD/JPY

The Japanese Yen stayed under heavy pressure at 160.55 against the US dollar as Japan’s energy import exposure worsens fundamentals. 

AUD/USD

The Australian Dollar headed south towards 0.7115 on broad USD strength pressured by geopolitical risk flows as Middle East tensions persist. 

USD/CAD

The Canadian dollar was slightly firmer at $1.3680 following the Bank of Canada held rates at 2.25% yesterday as expected, but the tone was cautiously hawkish-neutral.

USD/ZAR

The South African rand lost ground $16.8880 driven mainly by global risk aversion and higher oil prices, being negative for South Africa as a net importer, widening trade and inflation risks.
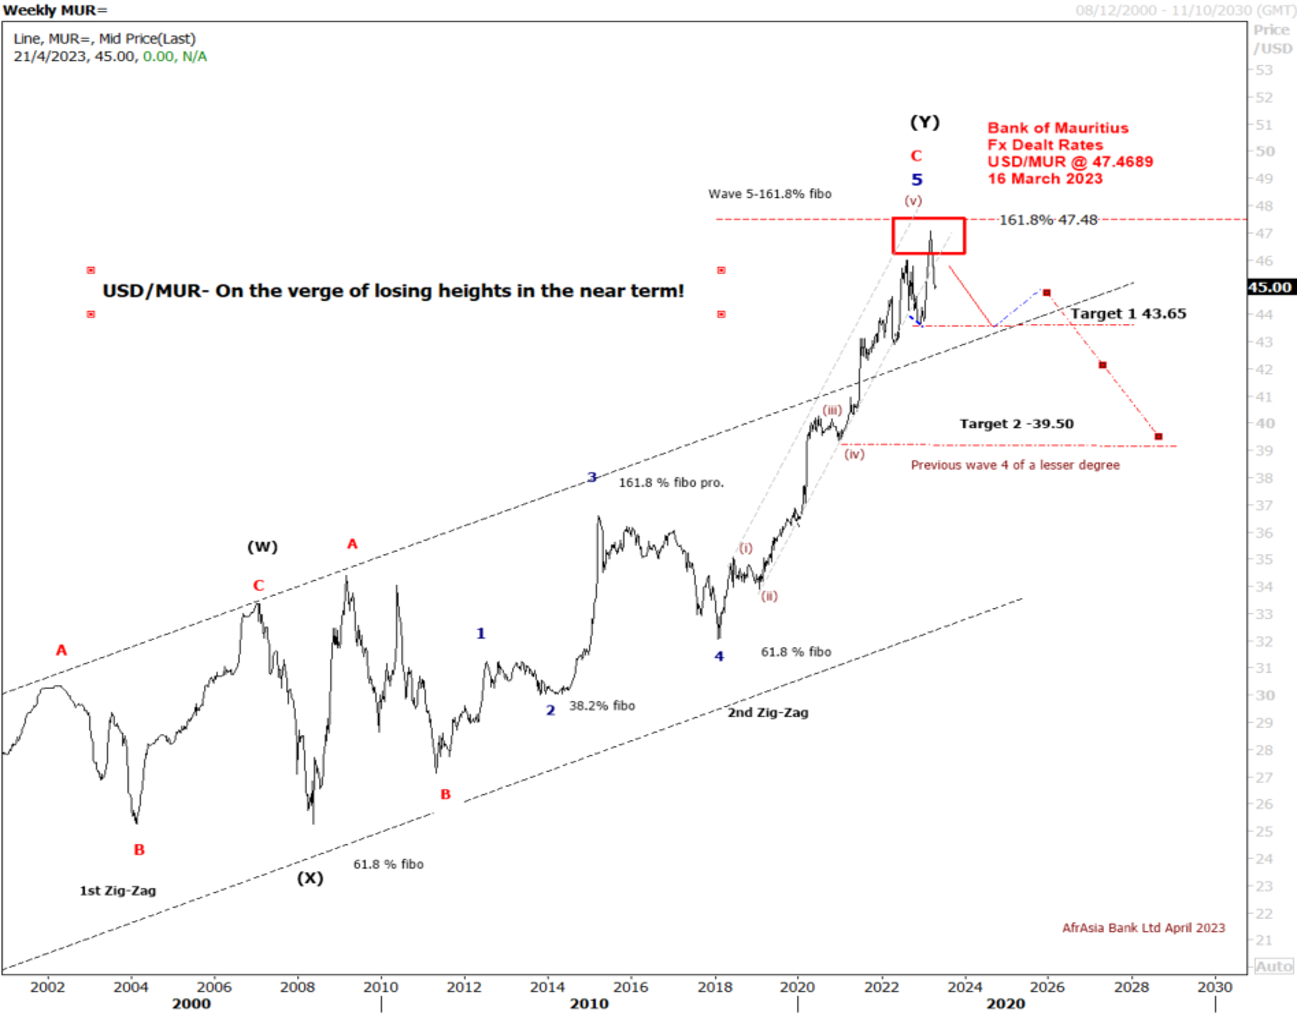
USD/MUR

The Dollar–Rupee is trading 21 cents higher at 47.48 (selling) this morning.

Fundamental & Technical Data
Economic Indicators-Local Time

10:00 AM EUR Retail Sales (YoY) (Mar)

10:45 AM EUR Consumer Price Index (EU norm) (YoY) (Apr) Prel

11:55 AM EUR Unemployment Change (Mar)

12:00 PM EUR Gross Domestic Product (QoQ) (Q1) Prel

1:00 PM EUR Core Harmonized Index of Consumer Prices (MoM) (Apr) Prel

1:00 PM EUR Core Harmonized Index of Consumer Prices (YoY) (Apr) Prel

1:00 PM EUR Gross Domestic Product s.a. (QoQ) (Q1) Prel

1:00 PM EUR Gross Domestic Product s.a. (YoY) (Q1) Prel

1:00 PM EUR Harmonized Index of Consumer Prices (MoM) (Apr) Prel

1:00 PM EUR Harmonized Index of Consumer Prices (YoY) (Apr) Prel

1:00 PM EUR Consumer Price Index (EU Norm) (YoY) (Apr) Prel

3:00 PM GBP BoE Interest Rate Decision

3:00 PM GBP BoE Minutes

3:00 PM GBP BoE Monetary Policy Report

4:15 PM EUR ECB Main Refinancing Operations Rate

4:15 PM EUR ECB Monetary Policy Statement

4:15 PM EUR ECB Rate On Deposit Facility

4:30 PM USD Core Personal Consumption Expenditures - Price Index (MoM) (Mar)

4:30 PM USD Gross Domestic Product Annualized (Q1) Prel

4:30 PM USD Initial Jobless Claims

4:30 PM USD Personal Consumption Expenditures - Price Index (MoM) (Mar)

4:45 PM EUR ECB Press Conference

Central Bank Interest Rates
Last Change
New Meeting
Federal Bank of U.S
4.0%
28-Oct-2025
09-Dec-2025
European Central Bank
2.00%
24-Jun-2025
18-Dec-2025
Bank of England
4.00%
07-Aug-2025
18-Dec-2025
Bank of Japan
0.5%
30-Jul-2025
19-Dec-2025
Reserve Bank of Australia
3.6%
20-May-2025
09-Dec-2025
S.Africa Reserve Bank
6.75%
20-Nov-2025
29-Jan-2026
Reserve Bank of India
5.5%
06-Jun-2025
05-Dec-2025
Bank of Mauritius
4.50%
04-Feb-2025
18-Dec-2025
Looking for Markets correlation?
Market Correlation is a measure, statistical or observational, that gives a positive or negative link between the pricing of multiple currencies.

Bulls & Bears Levels
Resistance and Support
Levels
EUR/USD
GBP/USD
USD/JPY
USD/ZAR
R3
1.1776
1.3588
161.79
17.33
R2
1.1750
1.3558
161.14
17.11
R1
1.1713
1.3517
160.79
16.97
PP
1.1687
1.3487
160.14
16.90
S1
1.1650
1.3446
159.79
16.89
S2
1.1624
1.3416
159.14
16.75
S3
1.1587
1.3375
158.79
16.61
Technical Analysis - Forex Charts
EUR/USD Technical Views- Double Zig-Zag (WXY) Structure; Larger-Degree Wave X Still Unfolding
Chart updated on 29.04.2026

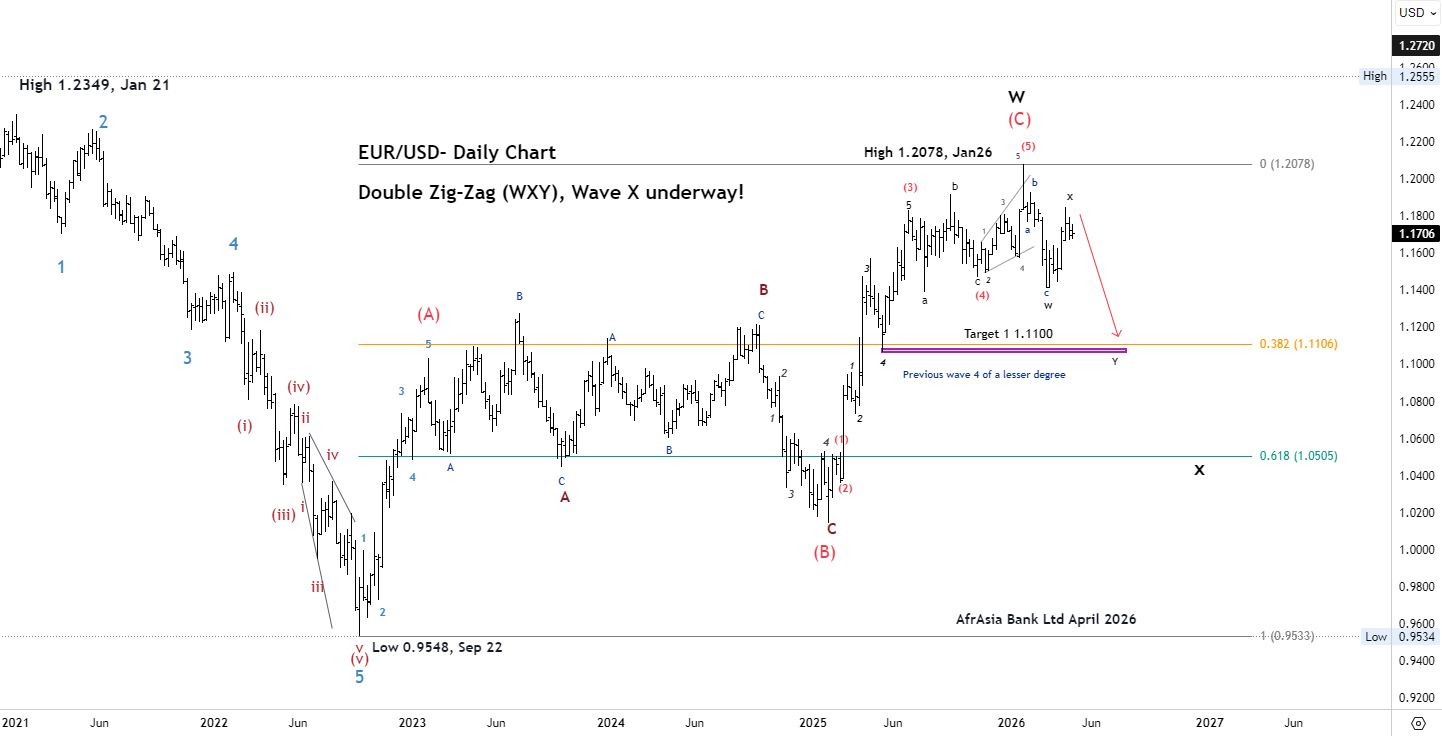
Technical News – EUR/USD
Double Zig-Zag (WXY) Structure; Larger-Degree Wave X Still Unfolding

Following a peak at $1.2078 on 26 January 2026, EUR/USD has retraced part of its 2025 gains, falling to $1.1411 before recovering toward the $1.17 area.

From an Elliott Wave perspective, the pair appears to have completed wave W and is currently unfolding a larger-degree wave X within a broader double zig-zag corrective structure (WXY). While elements of wave X's internal structure appear relatively mature, the overall corrective phase is still in progress.

The recent recovery toward $1.17 is therefore interpreted as part of this ongoing wave X, rather than the start of a new impulsive sequence. As such, once wave X completes, the pair is expected to transition into wave Y, resuming the broader corrective decline.

In this context, a move lower is anticipated over the coming months. In the near term, an initial downside target is seen at $1.1100, which marks a key support zone defined by the Fibonacci retracement (0.382) and the previous fourth wave of a lesser degree. Further downside extension remains possible as wave Y develops.

On the upside, a sustained break above the $1.20–$1.2078 area would invalidate the current WXY corrective scenario.

USD/MUR Outlook Bearish turn ahead !
Chart posted on 08.05.2023
EUR/MUR- A continuation of the uptrend!
Chart posted on 08.05.2023
The Pound is expected to experience a short-term rally before trending lower in wave C of a Zig-Zag corrective pattern
Chart posted on 12.08.2024
The Rand, an emerging market’s hero.
Chart posted on 24.09.2024
Yen bull, taking a breather before resuming its rally! 137.00
Chart posted on 12.08.2024
USDCAD - Medium term view
Chart posted on 27.08.2024
USD/JPY – Taking a step back to take two steps forward
Chart posted on 26.09.2024
The Aussie dollar- Medium Term View
Chart posted on 21.01.2025
Weekly Market Update by Devisha Ramsurrun
Speak to our team
  • Allan Juste
    Head - Forex And Derivatives
    +230 5251 4855
  • Reshma Peerun Rajwani
    Head – Treasury Sales
    +230 403 5500
Disclaimer
Please note that the information published is purely indicative. It is based on technical data from sources which the Bank verily believes to be authentic, though its timeliness or accuracy cannot be warranted or guaranteed. AfrAsia Bank Ltd issues no invitation to anyone to rely on this bulletin and neither we nor our information providers shall be in no way whatsoever, liable for any errors or inaccuracies, regardless of cause, or the lack of timeliness, or for any delay or interruption in the transmission thereof to the user. The indicative rates and other market information are subject to changes at the Bank's discretion. Whilst every effort is made to ensure the information is accurate, you should confirm the latest situation with the Bank prior to making any decisions.