
Well done is better than well said.
USD
EUR/USD
The sharp drop in the Euro to a low of $1.0918 took many traders aback yesterday ahead of a flurry of potential market-moving economic data releases later today.
GBP/USD
The pound sterling fell to $1.2680 on market’s anxiety ahead of the Bank of England monetary policy announcements.
USD/JPY
The Bank of Japan intervention in the bond market provided momentary support for the Japanese yen, but the Asian currency soon retreated to 143.89 against the greenback before stabilizing around 143.50.
AUD/USD
The Aussie started the month of August on the back foot, losing nearly 200 pips in the first two days of the month against the U.S. dollar to trade at $0.6540, as risk sentiment sours.
USD/CAD
The Canadian dollar made way for its U.S. counterpart, falling to 1.3340 as Oil prices give back some of their recent gains.
USD/ZAR
The South African rand slumped further to 18.50 against the greenback as risk-off sentiment increased on concerns about global economic growth.
USD/MUR
The dollar-rupee gained 5 cents to trade 45.70(selling) on the local FX market.
10:30 CHF Consumer Price Index
12:00 EUR Eurozone HCOB Composite PMI
13:00 EUR Eurozone Producer Price Index
15:00 GBP BoE Interest Rate Decision
15:30 GBP BoE's Governor Bailey speech
16:30 USD Initial Jobless Claims
17:45 USD S&P Global Composite PMI
18:00 USD ISM Services PMI

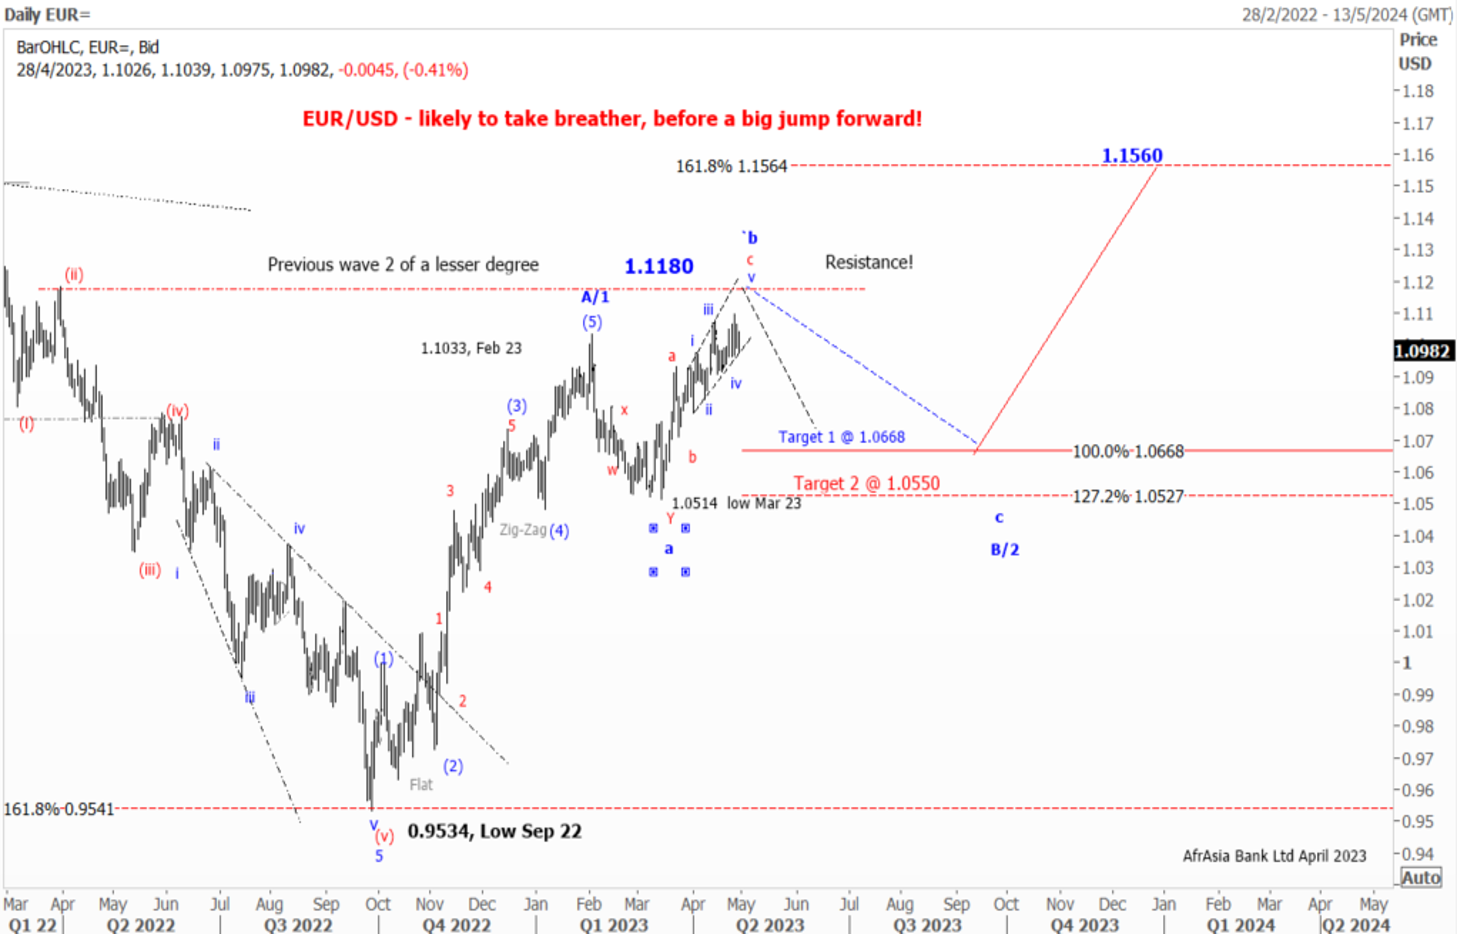
As expected, the EUR/USD has been on a steep uptrend since September 2022 on hawkish ECB.
Elliott wave pattern
Daily Chart
A Clear impulsive 5-wave structure from a low of $0.9534 to a high of $ 1.1035 in February 2023
Possible Expanding Diagonal in wave c of wave b of a flat correction
Forecast
Short term
We expect a corrective setback in wave C in the coming month
1st target 1.1.0670 Wave a =Wave C of a flat correction
2nd Target 1.0530- Wave a =127.2% of wave C of a flat correction
Long term
Once the pullback is completed, we might see the EUR/USD jumping out of the block to $1.1560, followed by $1.2000 by year-end of 2023
News
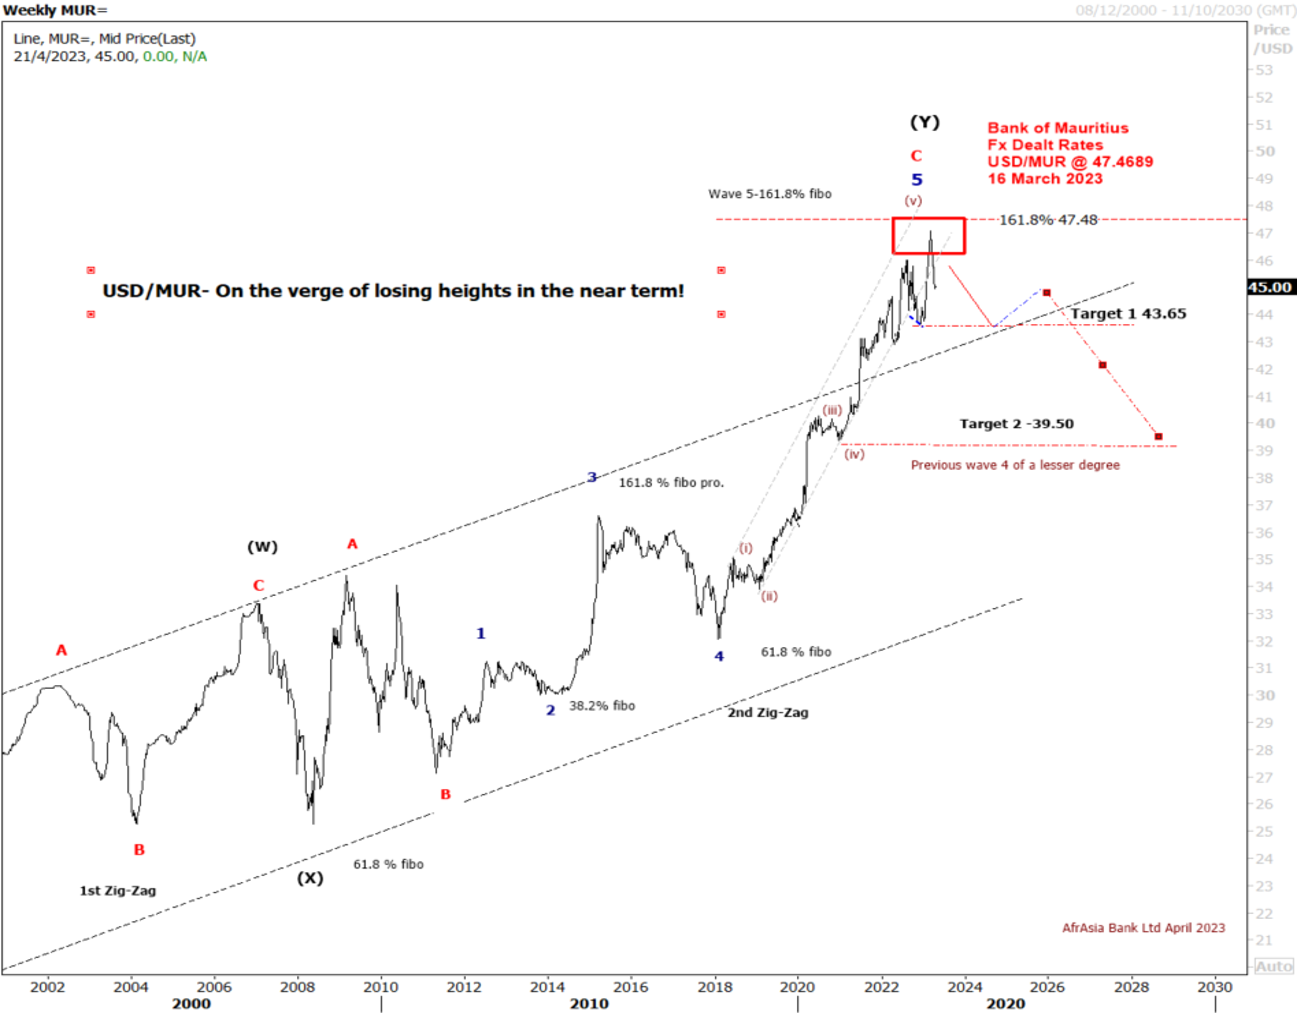
The USD/MUR suddenly burst to a new high at 47.48 in March, driven by FX liquidity concerns, before BOM stepped in to smooth the excessive volatility and injected USD 30 mio on the domestic market.
The USD/MUR fell sharply to 45.40 in the wake of three interventions of the Bank of Mauritius from March 2023 to date.
Elliott wave pattern- Weekly Chart
Double zig-zag upward correction in wave W-X-Y, since 2000 completed!
Bearish turn ahead!
Clear 5-wave structure in wave 5 of wave C of wave (Y)
Over the last four years, the USD/MUR surged by 42% from a low of 32.90 in wave 4 to reach an all-time high of 47.47 on 16th of March 2023, before falling back to 45.40 in an impulsive decline from Mid-March to late April 2023
Forecast- USD/MUR on the brink of a downturn in Q2-Q4 of 2023
On the weekly USD/MUR chart, It seems that the pair may have completed a five-wave upward rally in sub-wave (v) of Wave 5 of Wave C of Wave Y with a peak of 47.47 on the 16th of March
Our Short term target is for a downward trend towards 44.00 followed by 43.00 in December 2023
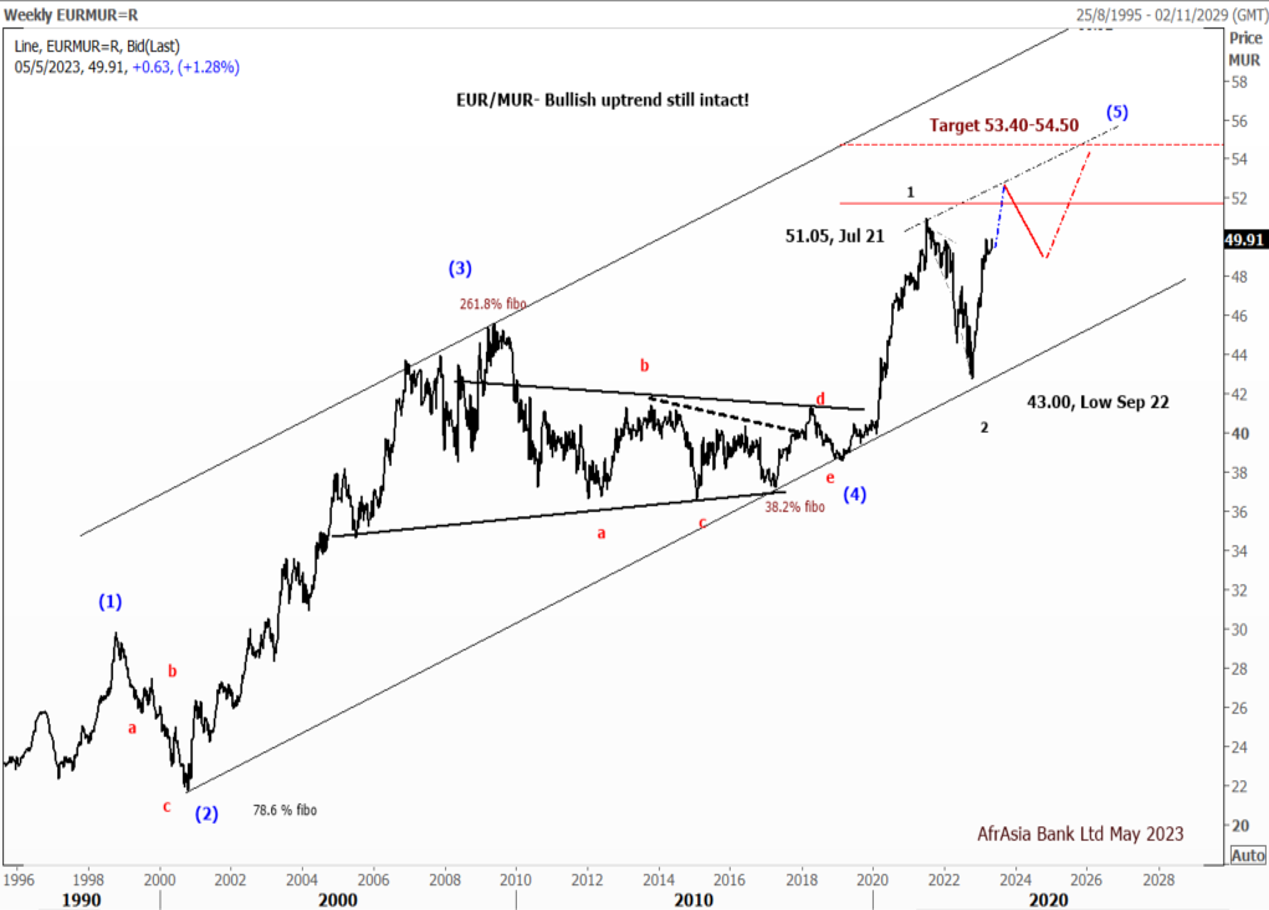
Forecast
EUR/MUR- On the weekly chart, the EUR/MUR may extend its rally in the short term above the high of 51.05 printed in July 2021.
From a technical perspective, on a break of the previous high at 51.05, the pair may find resistance at 52.00, followed by 52.50 by June 2023.
However, we expected the pair to pare some of its gains to 48.50 by September 2023 before a resumption of the uptrend to 53.40-54.50 by December 2023
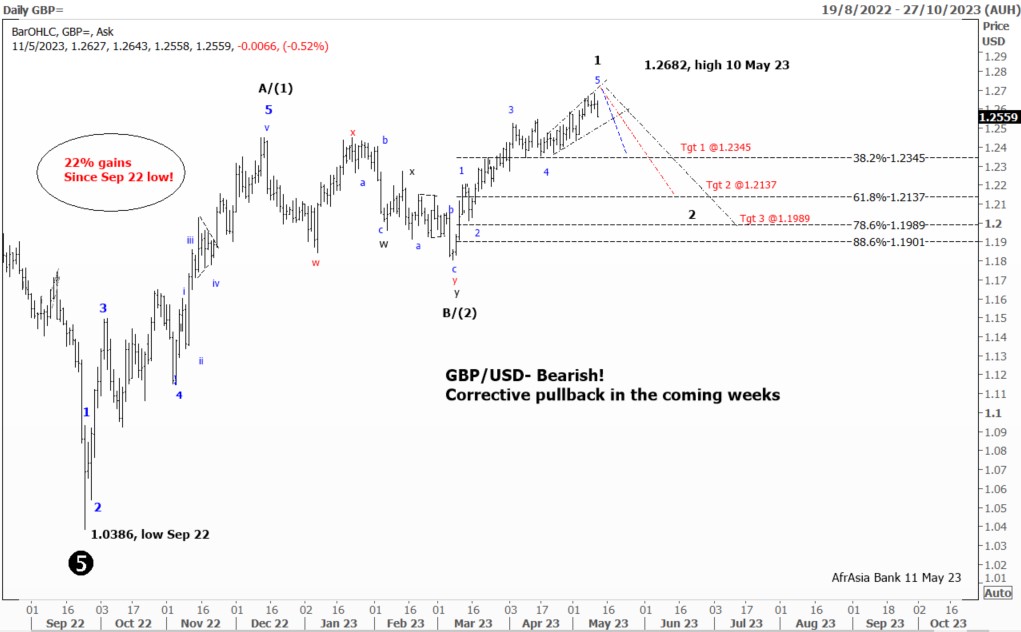
The Pound has bagged about 5.7% against the U.S. dollar this year to reach a 1-year high of $1.2682 on the 10th of May 2023 and is up some 17% from lows hit $1.0386 in the wake of September’s disastrous mini-budget.
From an Elliott Wave perspective, the GBP/USD remains in a long-term uptrend but could feel the pain of a corrective setback in the upcoming weeks. A break below the bullish trend channel at $1.2500 would open the door for further decline near $1.2345 (previous wave 4 of a lesser degree), followed by $1.2337 (61.8% Fibonacci retracement from a high of 1.2682), and lastly at $1.1900 (78.6% Fibonacci retracement). On the upside, stiff resistance has formed at 1.2645 and 1.2680 could be seen as the next bullish target.