
In order to succeed, we must first believe that we can .
USD
EUR/USD
The Shared Currency faded from $1.0749 to $1.0695 after U.S. Consumer Confidence data in May was higher to 102.3 than expected.
GBP/USD
The Cable jumped to $1.2388 on signs of persistence in the United Kingdom's inflation, solidifying the need for more interest rate hikes from the Bank of England in June.
USD/JPY
The Japanese yen soared to 139.45 versus the greenback despite the drop in Industrial Production and Retail sales data released this morning.
AUD/USD
The Aussie dollar lost ground towards $0.6496 despite the uptick in Australia's monthly inflation print to 6.8% versus 6.4% below estimates.
USD/CAD
The Loonie dipped to 1.3632 against its U.S. counterpart following a slump in the WTI oil price.
USD/ZAR
The South African rand hit a record low of 19.88 against a strengthening dollar and souring local investor sentiment that has seen massive capital outflows from South Africa.
USD/MUR
The dollar-rupee steadied at 46.15(Selling) this morning.
Holidays
11.55 EUR- German Unemployment Change
16.00 EUR - German CPI
16.30 CAD - GDP
16.30 EUR- ECB President Lagarde Speaks
18.00 USD- JOLTs Job Opening

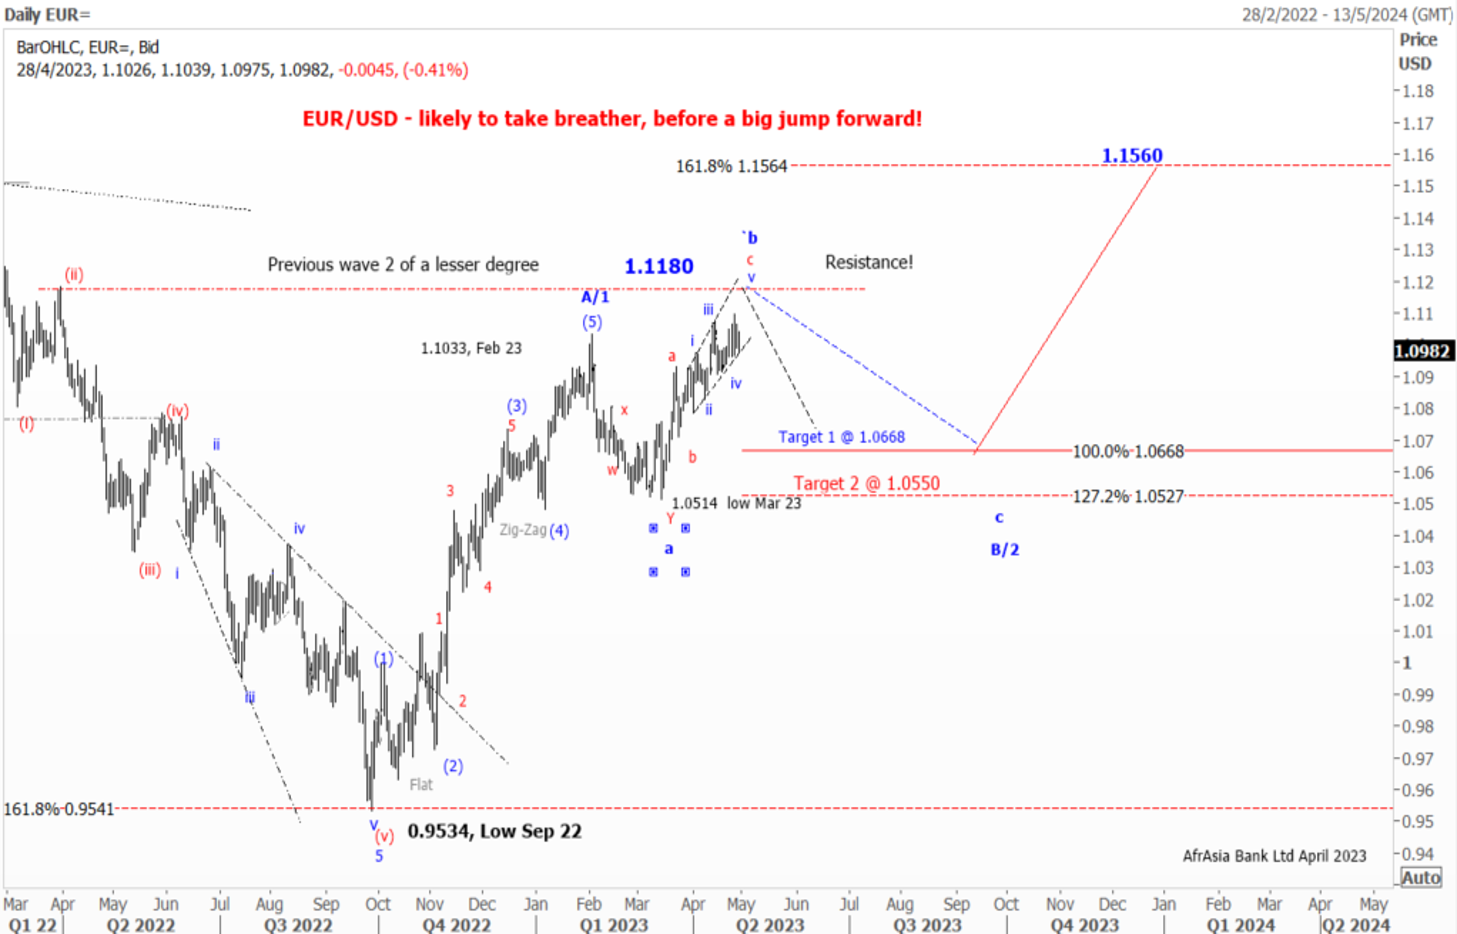
As expected, the EUR/USD has been on a steep uptrend since September 2022 on hawkish ECB.
Elliott wave pattern
Daily Chart
A Clear impulsive 5-wave structure from a low of $0.9534 to a high of $ 1.1035 in February 2023
Possible Expanding Diagonal in wave c of wave b of a flat correction
Forecast
Short term
We expect a corrective setback in wave C in the coming month
1st target 1.1.0670 Wave a =Wave C of a flat correction
2nd Target 1.0530- Wave a =127.2% of wave C of a flat correction
Long term
Once the pullback is completed, we might see the EUR/USD jumping out of the block to $1.1560, followed by $1.2000 by year-end of 2023
News
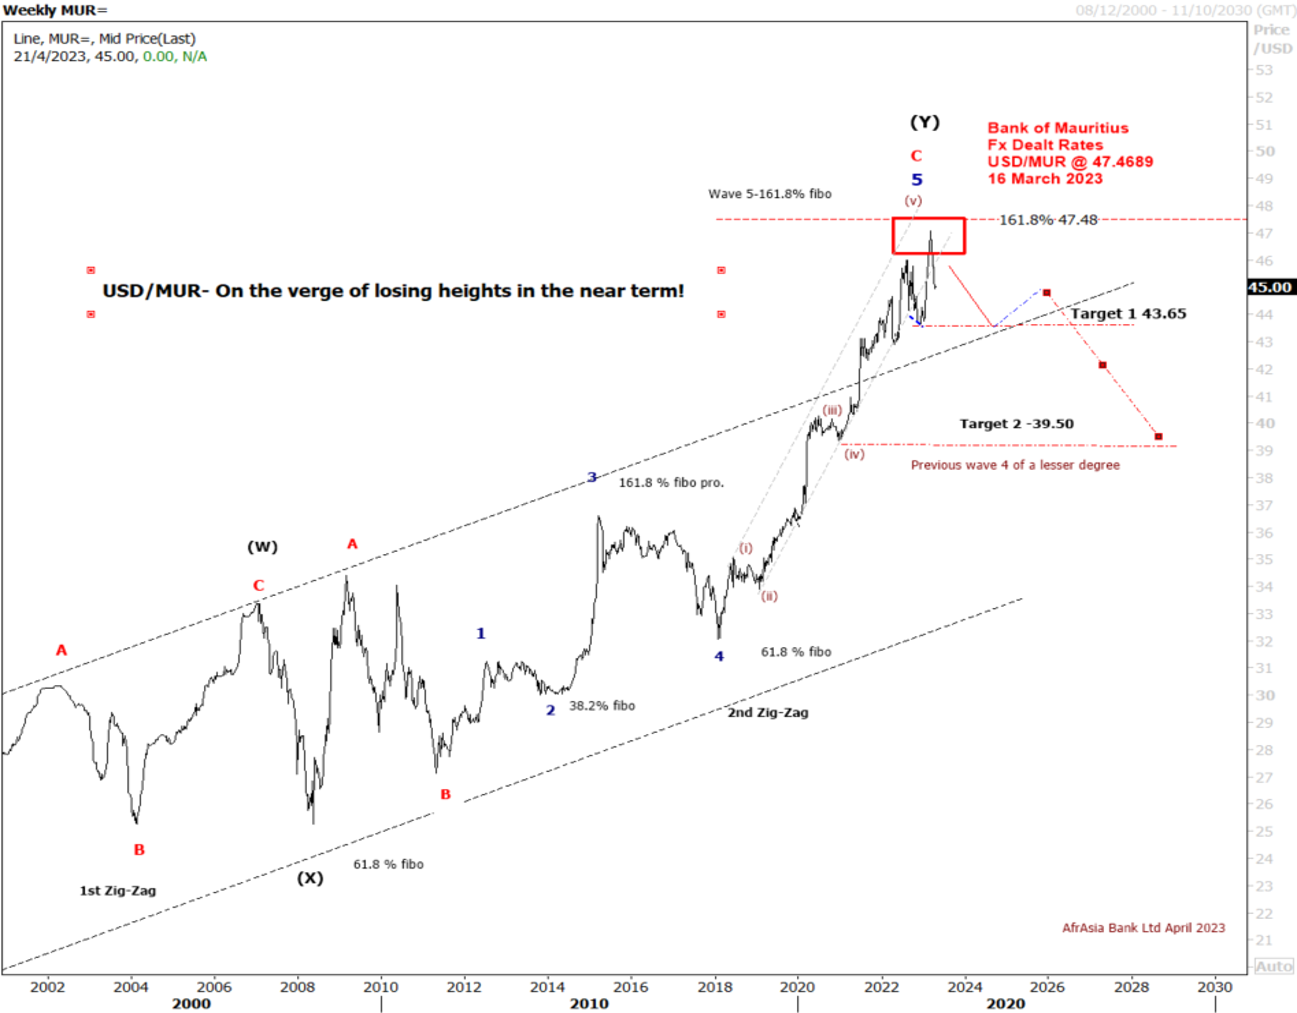
The USD/MUR suddenly burst to a new high at 47.48 in March, driven by FX liquidity concerns, before BOM stepped in to smooth the excessive volatility and injected USD 30 mio on the domestic market.
The USD/MUR fell sharply to 45.40 in the wake of three interventions of the Bank of Mauritius from March 2023 to date.
Elliott wave pattern- Weekly Chart
Double zig-zag upward correction in wave W-X-Y, since 2000 completed!
Bearish turn ahead!
Clear 5-wave structure in wave 5 of wave C of wave (Y)
Over the last four years, the USD/MUR surged by 42% from a low of 32.90 in wave 4 to reach an all-time high of 47.47 on 16th of March 2023, before falling back to 45.40 in an impulsive decline from Mid-March to late April 2023
Forecast- USD/MUR on the brink of a downturn in Q2-Q4 of 2023
On the weekly USD/MUR chart, It seems that the pair may have completed a five-wave upward rally in sub-wave (v) of Wave 5 of Wave C of Wave Y with a peak of 47.47 on the 16th of March
Our Short term target is for a downward trend towards 44.00 followed by 43.00 in December 2023
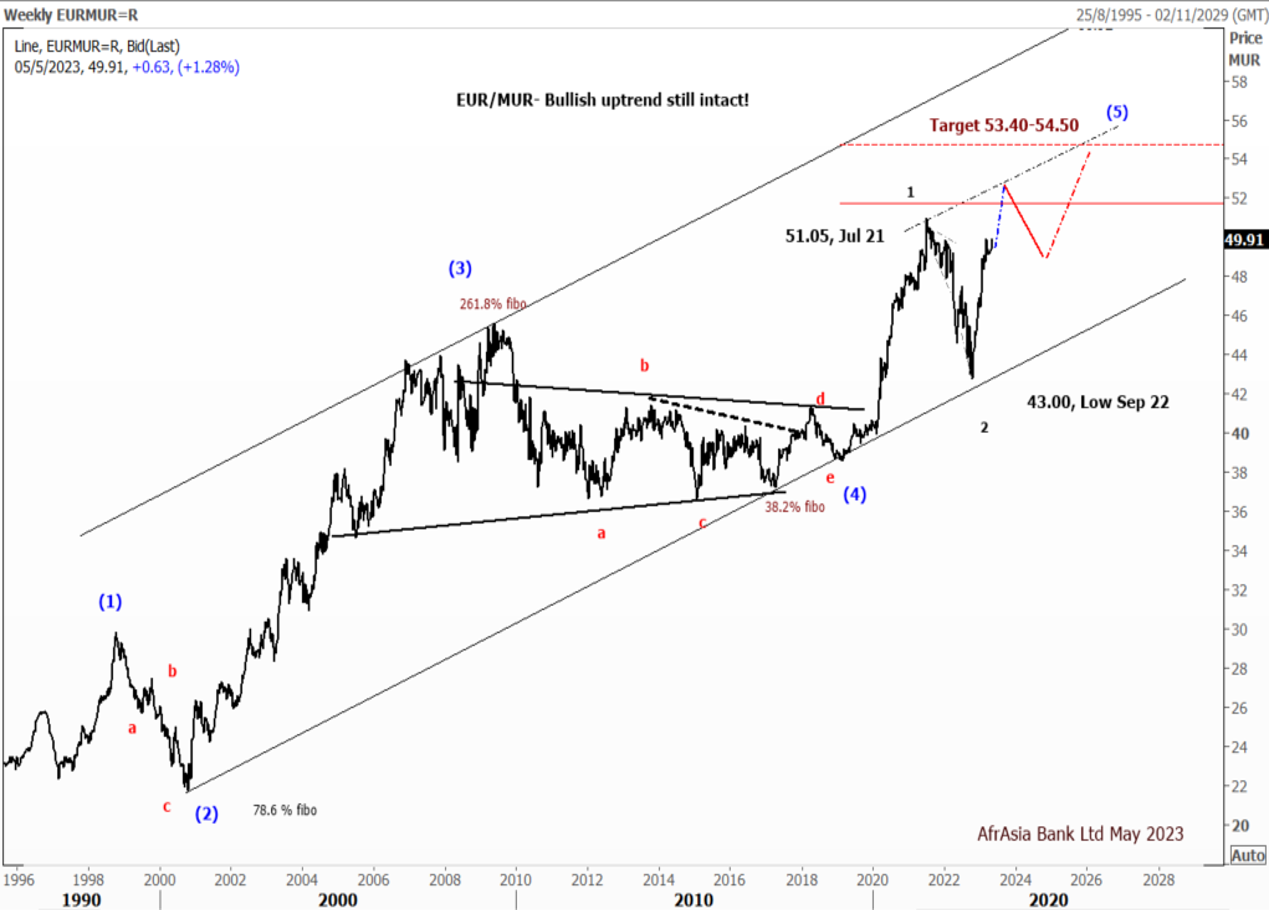
Forecast
EUR/MUR- On the weekly chart, the EUR/MUR may extend its rally in the short term above the high of 51.05 printed in July 2021.
From a technical perspective, on a break of the previous high at 51.05, the pair may find resistance at 52.00, followed by 52.50 by June 2023.
However, we expected the pair to pare some of its gains to 48.50 by September 2023 before a resumption of the uptrend to 53.40-54.50 by December 2023
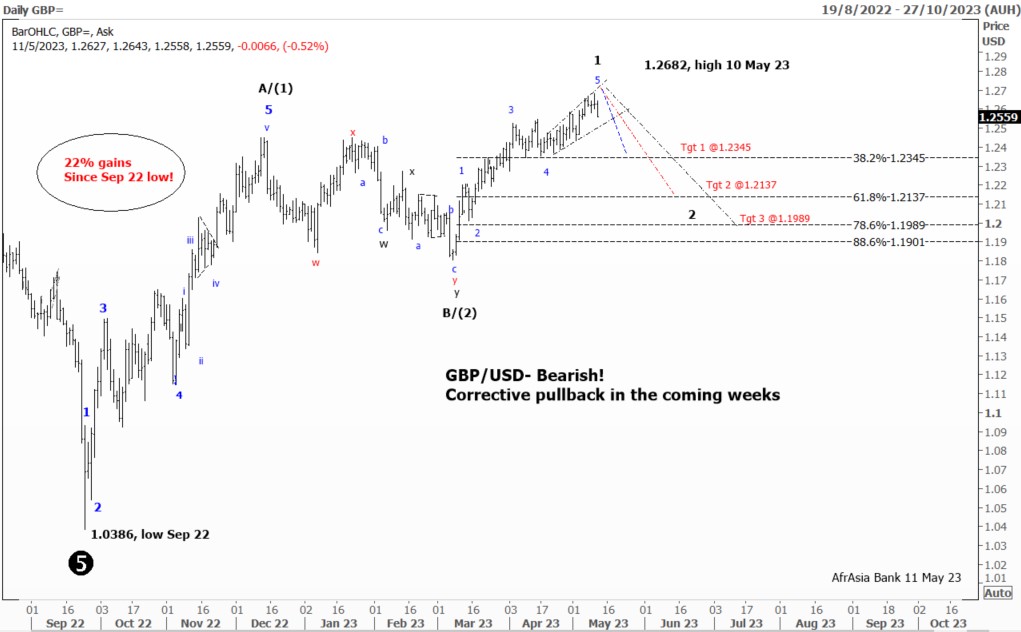
The Pound has bagged about 5.7% against the U.S. dollar this year to reach a 1-year high of $1.2682 on the 10th of May 2023 and is up some 17% from lows hit $1.0386 in the wake of September’s disastrous mini-budget.
From an Elliott Wave perspective, the GBP/USD remains in a long-term uptrend but could feel the pain of a corrective setback in the upcoming weeks. A break below the bullish trend channel at $1.2500 would open the door for further decline near $1.2345 (previous wave 4 of a lesser degree), followed by $1.2337 (61.8% Fibonacci retracement from a high of 1.2682), and lastly at $1.1900 (78.6% Fibonacci retracement). On the upside, stiff resistance has formed at 1.2645 and 1.2680 could be seen as the next bullish target.