
"Trading doesn’t just reveal your character; it also builds it if you stay in the game long enough.”
USD
EUR/USD
The Single currency dribbled to $1.0740 as the German economy, Europe's largest, fell into recession after reporting a contraction in Q1 real Gross Domestic Product (GDP) by 0.3%.
GBP/USD
The Cable eased to $1.2335 on U.S. dollar strength despite U.K. Retail Sales being stronger than expected from 0.4% to 0.5%.
USD/JPY
The Japanese yen lessened to 139.72 against the U.S. dollar after a lower-than-expected reading of the Tokyo Core Consumer Price Index (CPI) from 3.5% in April to 3.2% in May.
AUD/USD
The Aussie dollar languished to $0.6515 on negative Australia Retail Sales data from 0.4% to 0% released this morning.
USD/CAD
The Canadian dollar curtailed to 1.3641 against the greenback after the U.S. initial jobless claims drove lower by 4k to 229K on Thursday, coupled with news that the U.S. President Joe Biden and top Congressional Republican Kevin McCarthy appeared to be nearing a deal on the debt ceiling today.
USD/ZAR
South Africa's rand nosedived against the greenback as the South Africa Central Bank raised its benchmark lending rate by 50 basis points to 8.25%, its 10th consecutive hike in a row, taking it to a 14-year high as the central bank scrambles to tame inflation.
USD/MUR
The dollar-rupee steadied at 46.10(Selling).
16:30 USD Core Durable Goods Orders
16:30 - USD - Core PCE Price index

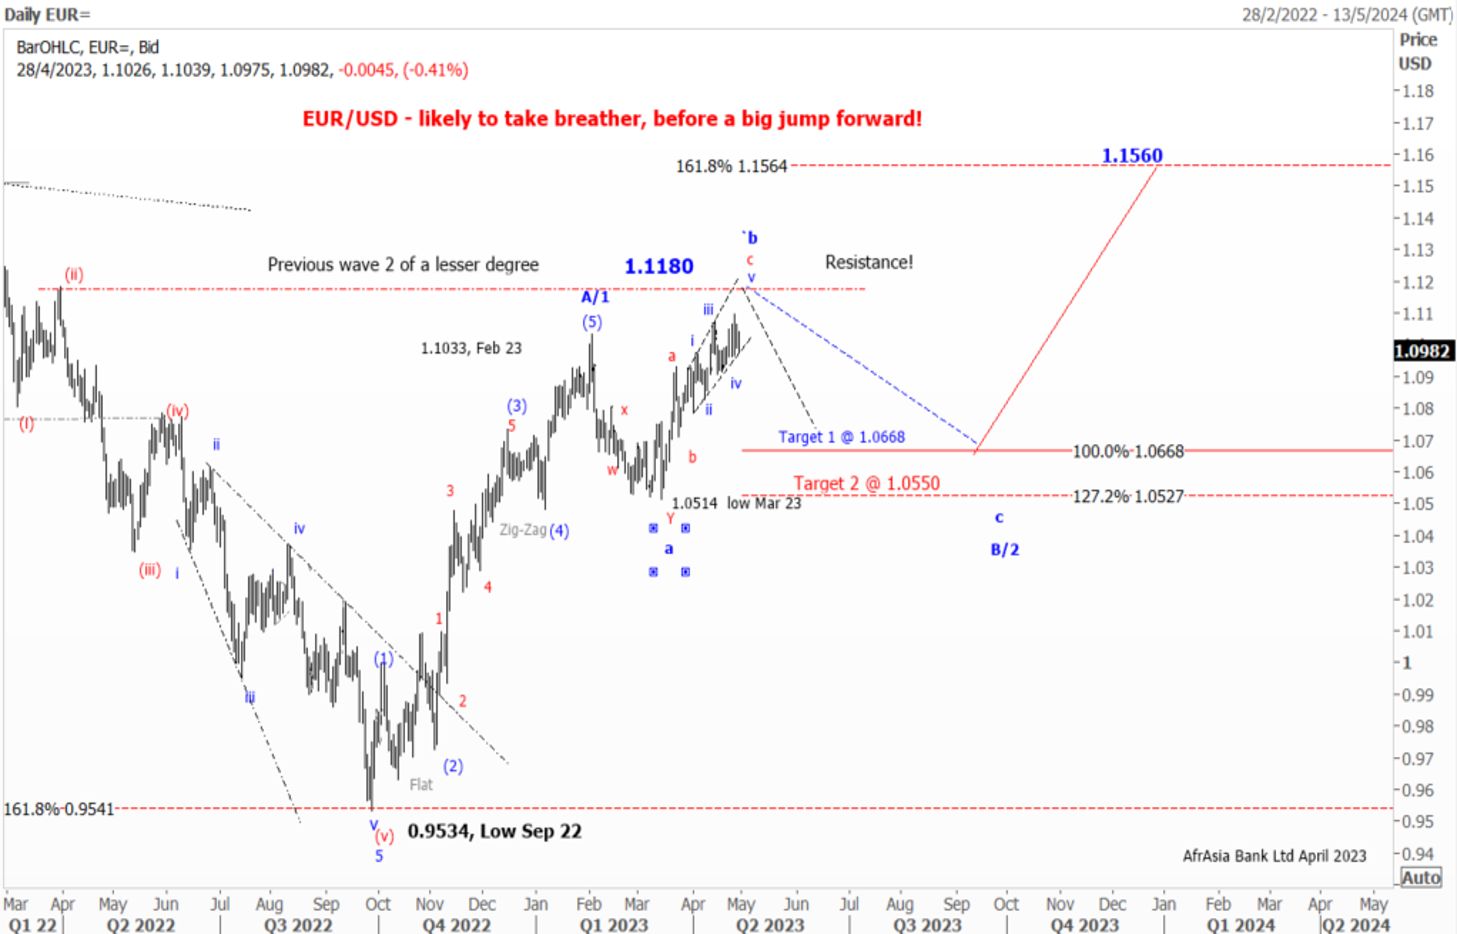
As expected, the EUR/USD has been on a steep uptrend since September 2022 on hawkish ECB.
Elliott wave pattern
Daily Chart
A Clear impulsive 5-wave structure from a low of $0.9534 to a high of $ 1.1035 in February 2023
Possible Expanding Diagonal in wave c of wave b of a flat correction
Forecast
Short term
We expect a corrective setback in wave C in the coming month
1st target 1.1.0670 Wave a =Wave C of a flat correction
2nd Target 1.0530- Wave a =127.2% of wave C of a flat correction
Long term
Once the pullback is completed, we might see the EUR/USD jumping out of the block to $1.1560, followed by $1.2000 by year-end of 2023
News
The USD/MUR suddenly burst to a new high at 47.48 in March, driven by FX liquidity concerns, before BOM stepped in to smooth the excessive volatility and injected USD 30 mio on the domestic market.
The USD/MUR fell sharply to 45.40 in the wake of three interventions of the Bank of Mauritius from March 2023 to date.
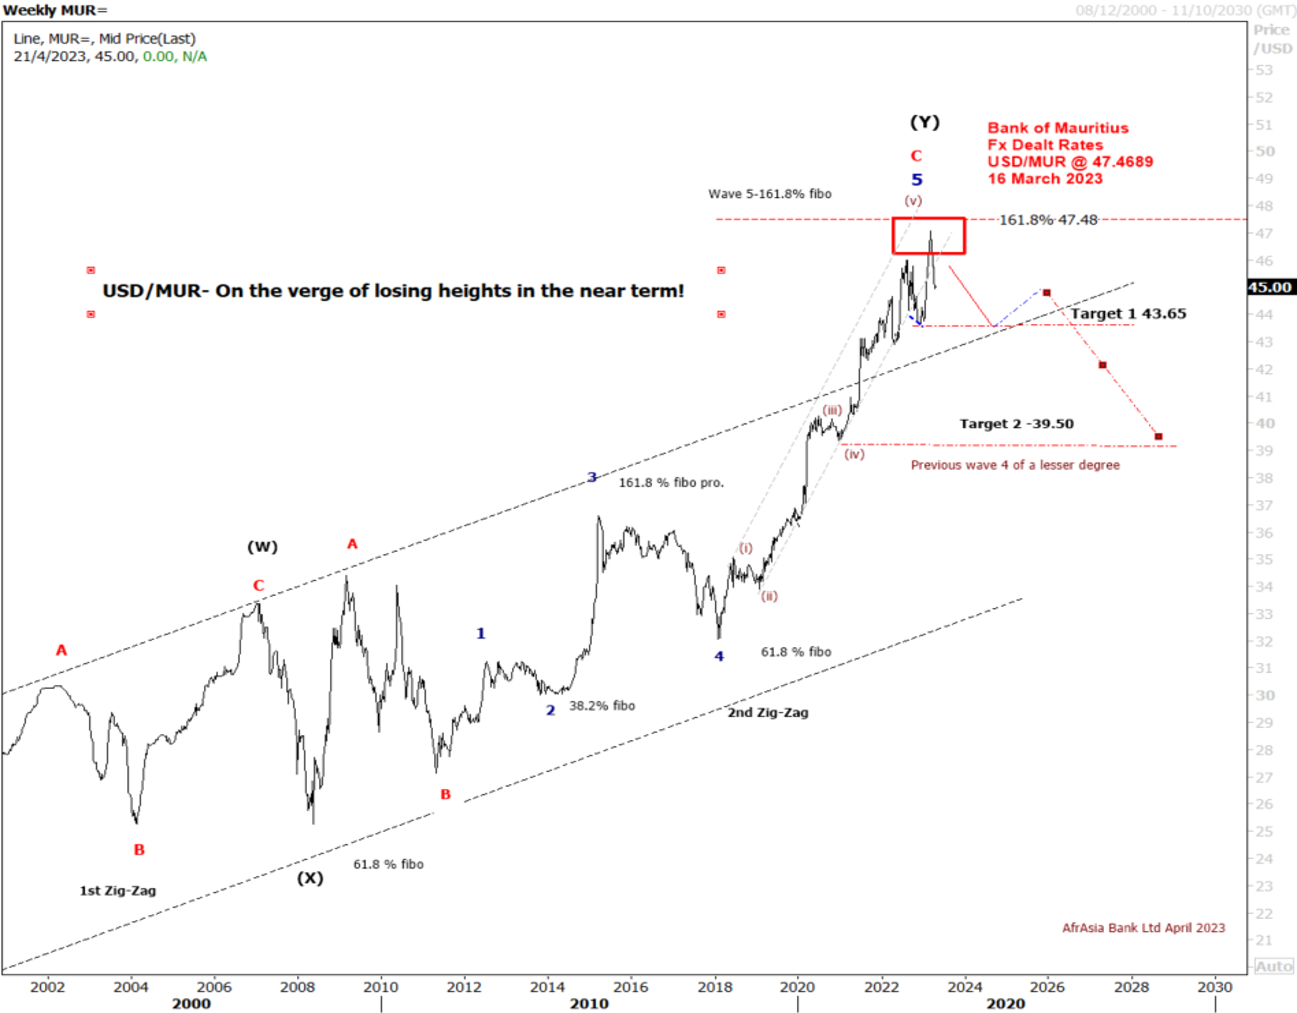
Elliott wave pattern- Weekly Chart
Double zig-zag upward correction in wave W-X-Y, since 2000 completed!
Bearish turn ahead!
Clear 5-wave structure in wave 5 of wave C of wave (Y)
Over the last four years, the USD/MUR surged by 42% from a low of 32.90 in wave 4 to reach an all-time high of 47.47 on 16th of March 2023, before falling back to 45.40 in an impulsive decline from Mid-March to late April 2023
Forecast- USD/MUR on the brink of a downturn in Q2-Q4 of 2023
On the weekly USD/MUR chart, It seems that the pair may have completed a five-wave upward rally in sub-wave (v) of Wave 5 of Wave C of Wave Y with a peak of 47.47 on the 16th of March
Our Short term target is for a downward trend towards 44.00 followed by 43.00 in December 2023
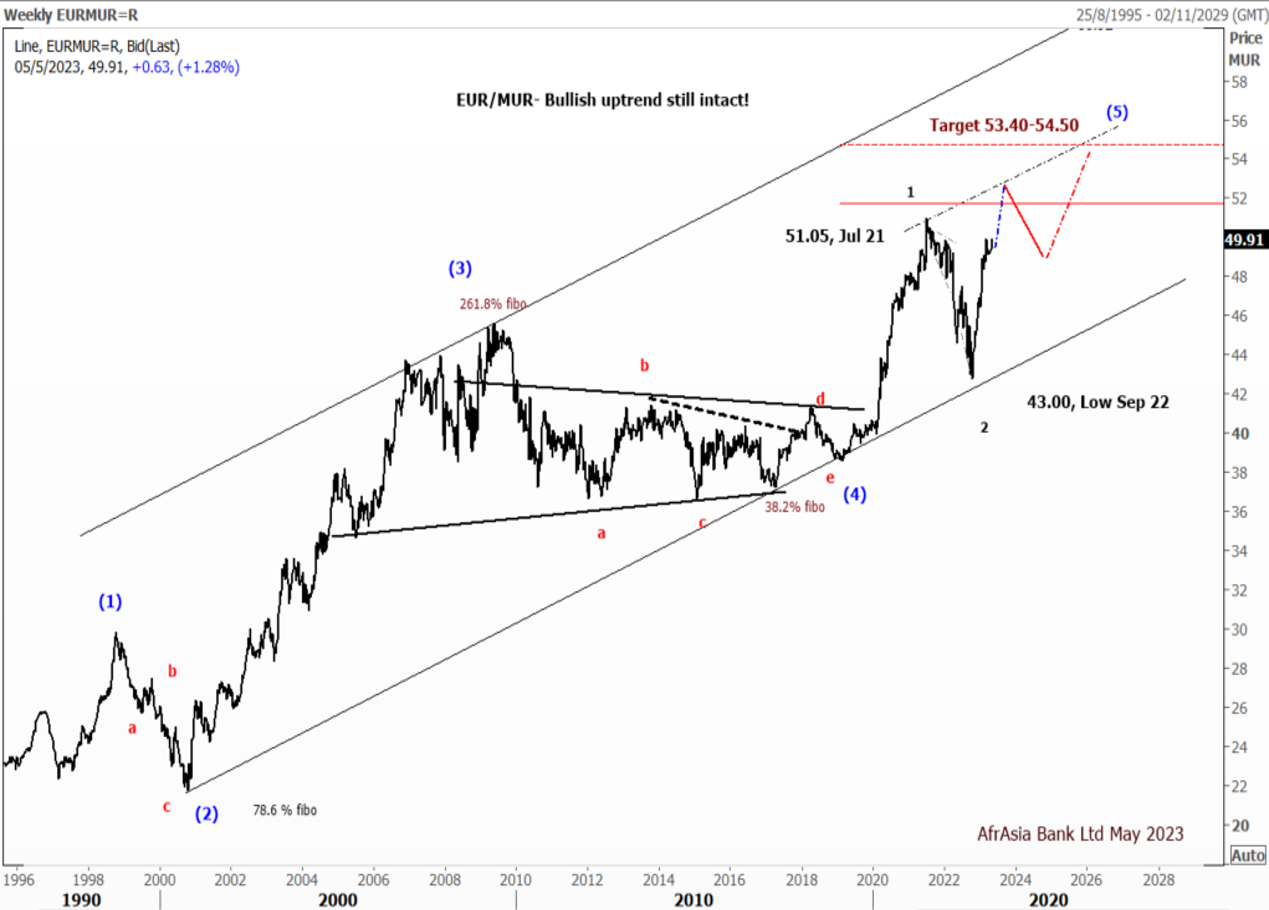
Forecast
EUR/MUR- On the weekly chart, the EUR/MUR may extend its rally in the short term above the high of 51.05 printed in July 2021.
From a technical perspective, on a break of the previous high at 51.05, the pair may find resistance at 52.00, followed by 52.50 by June 2023.
However, we expected the pair to pare some of its gains to 48.50 by September 2023 before a resumption of the uptrend to 53.40-54.50 by December 2023
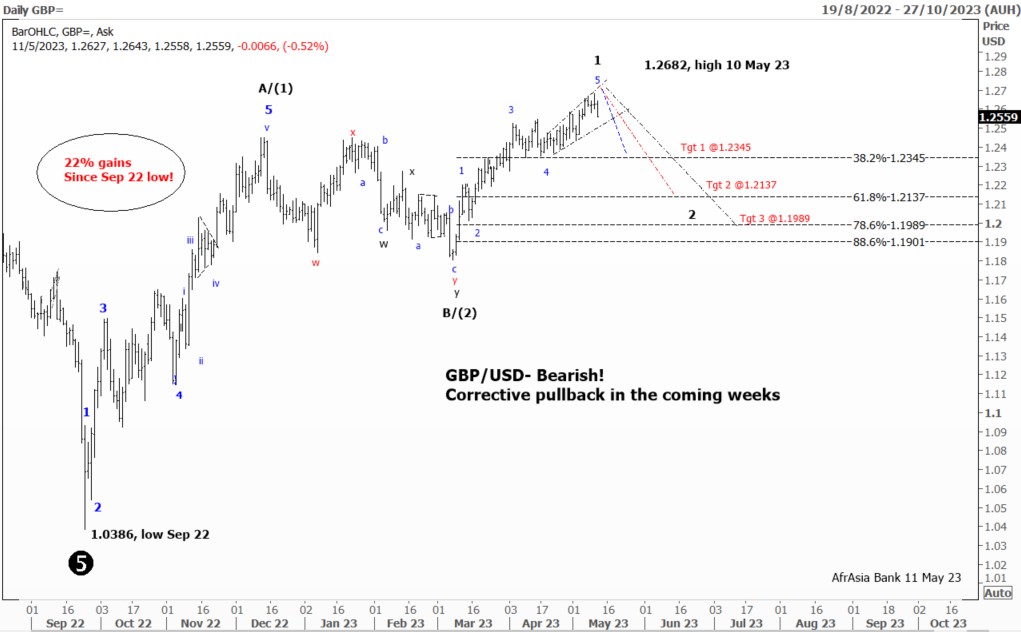
The Pound has bagged about 5.7% against the U.S. dollar this year to reach a 1-year high of $1.2682 on the 10th of May 2023 and is up some 17% from lows hit $1.0386 in the wake of September’s disastrous mini-budget.
From an Elliott Wave perspective, the GBP/USD remains in a long-term uptrend but could feel the pain of a corrective setback in the upcoming weeks. A break below the bullish trend channel at $1.2500 would open the door for further decline near $1.2345 (previous wave 4 of a lesser degree), followed by $1.2337 (61.8% Fibonacci retracement from a high of 1.2682), and lastly at $1.1900 (78.6% Fibonacci retracement). On the upside, stiff resistance has formed at 1.2645 and 1.2680 could be seen as the next bullish target.