
Arriving at one goal is the starting point to another.
USD
EUR/USD
The Single Currency handed over its gains to $1.0825 this morning after touching a daily high of $1.0863 yesterday, fostered by a 1% increase in the Euro Zone Industrial production figure published yesterday. Market participants eagerly await the European Central Bank interest rate decision later today.
GBP/USD
The Cable roared to $1.2660 after data showed Britain's economy grew modestly in April, as traders remained unnerved by an earlier release signaling sticky inflation.
USD/JPY
The Japanese Yen nosedived to 141.30 against the greenback, near a 7-month low, following the FOMC decision to keep interest rates unchanged in the U.S. while also signaling two more hikes this year.
AUD/USD
The Australian dollar catapulted to $0.6805 as employment figures published this morning showed surprising resilience, a development which the Reserve Bank will closely monitor upon their next interest rate decision next month.
USD/CAD
The Loonie was on the back foot at 1.3345 against the dollar, in tandem with a drop in oil price following gloomier Chinese Industrial Output and Retail Sales growth figures, reinforcing concerns about the recovery of one of the biggest oil importers.
USD/ZAR
The South African rand slid to 18.42 against the buck partly due to a lower than expected Retail Sales figure and poorer than anticipated Business Confidence data.
USD/MUR
The dollar-rupee was stuck in a rut at 45.95(Selling) this morning.
16.15 EUR ECB Interest Rate Decision
16.30 USD Core Retail Sales
16.30 USD initial Jobless Claims.

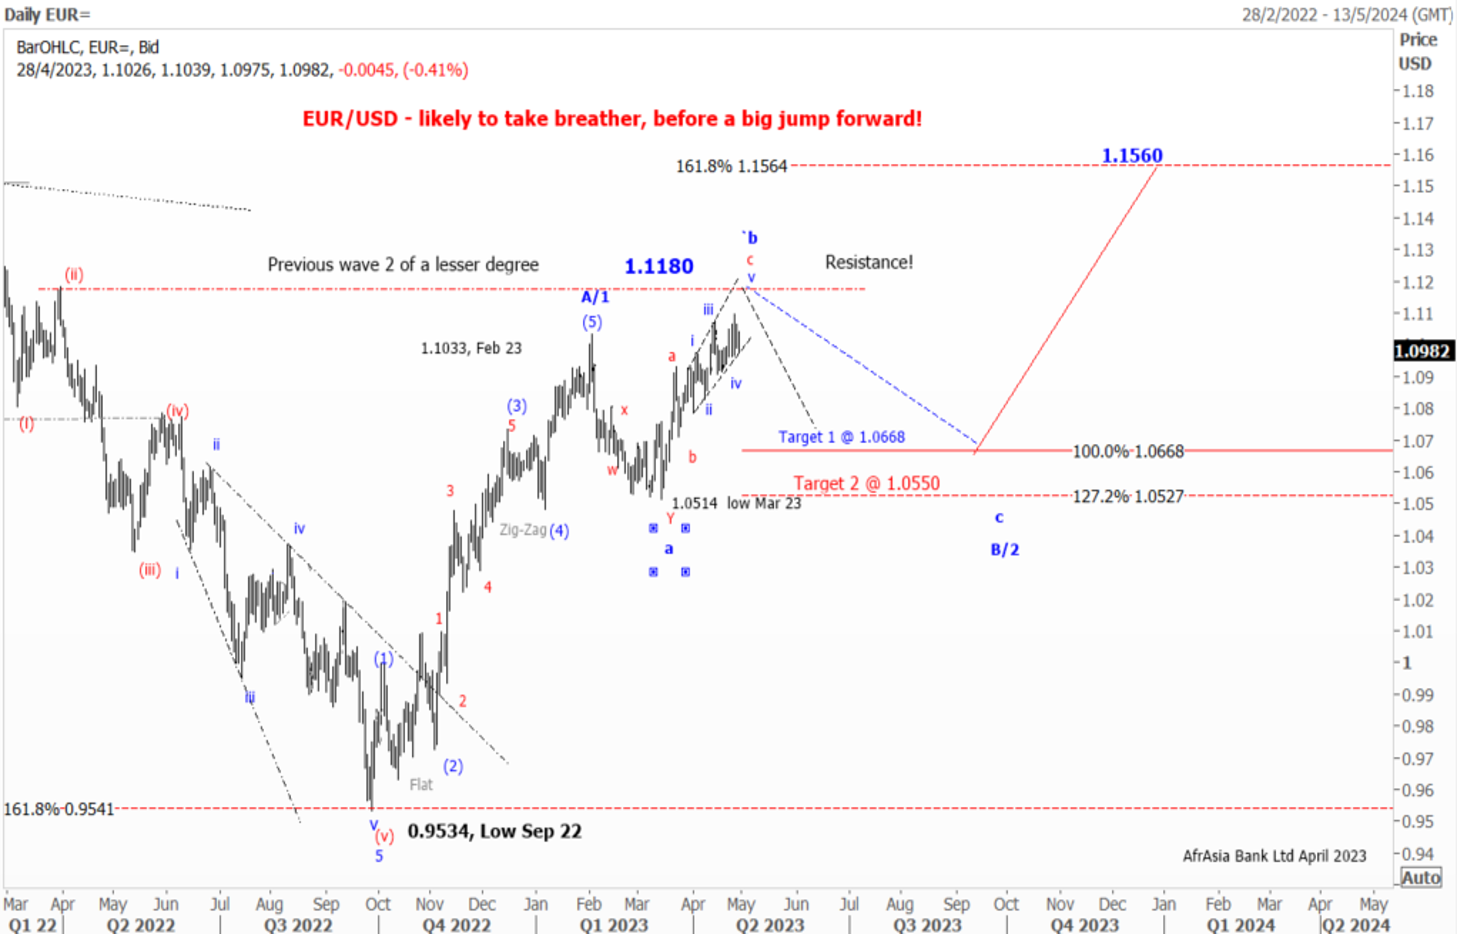
As expected, the EUR/USD has been on a steep uptrend since September 2022 on hawkish ECB.
Elliott wave pattern
Daily Chart
A Clear impulsive 5-wave structure from a low of $0.9534 to a high of $ 1.1035 in February 2023
Possible Expanding Diagonal in wave c of wave b of a flat correction
Forecast
Short term
We expect a corrective setback in wave C in the coming month
1st target 1.1.0670 Wave a =Wave C of a flat correction
2nd Target 1.0530- Wave a =127.2% of wave C of a flat correction
Long term
Once the pullback is completed, we might see the EUR/USD jumping out of the block to $1.1560, followed by $1.2000 by year-end of 2023
News
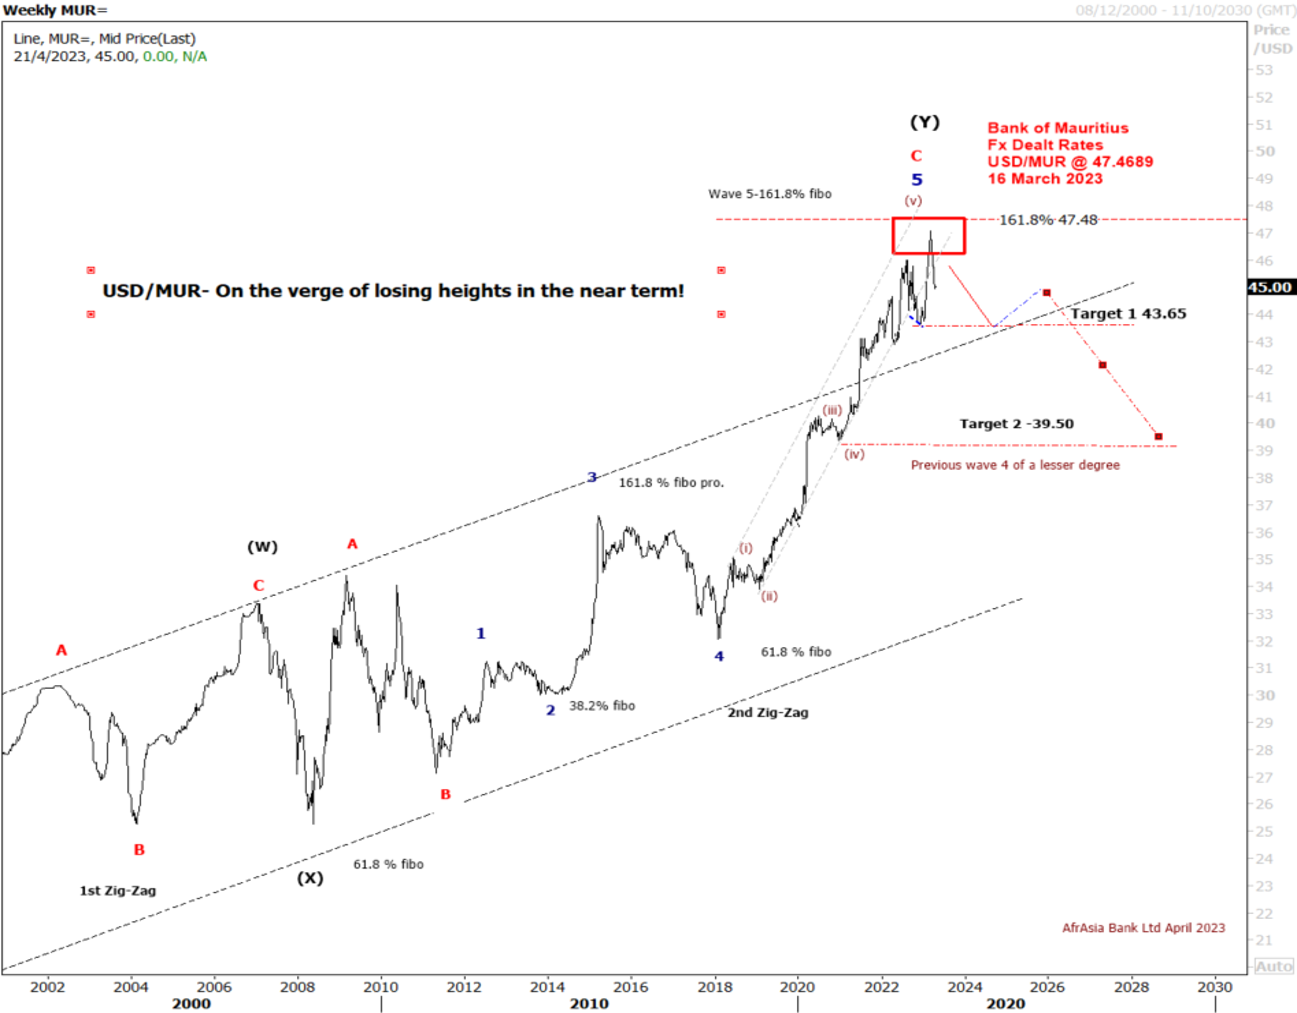
The USD/MUR suddenly burst to a new high at 47.48 in March, driven by FX liquidity concerns, before BOM stepped in to smooth the excessive volatility and injected USD 30 mio on the domestic market.
The USD/MUR fell sharply to 45.40 in the wake of three interventions of the Bank of Mauritius from March 2023 to date.
Elliott wave pattern- Weekly Chart
Double zig-zag upward correction in wave W-X-Y, since 2000 completed!
Bearish turn ahead!
Clear 5-wave structure in wave 5 of wave C of wave (Y)
Over the last four years, the USD/MUR surged by 42% from a low of 32.90 in wave 4 to reach an all-time high of 47.47 on 16th of March 2023, before falling back to 45.40 in an impulsive decline from Mid-March to late April 2023
Forecast- USD/MUR on the brink of a downturn in Q2-Q4 of 2023
On the weekly USD/MUR chart, It seems that the pair may have completed a five-wave upward rally in sub-wave (v) of Wave 5 of Wave C of Wave Y with a peak of 47.47 on the 16th of March
Our Short term target is for a downward trend towards 44.00 followed by 43.00 in December 2023
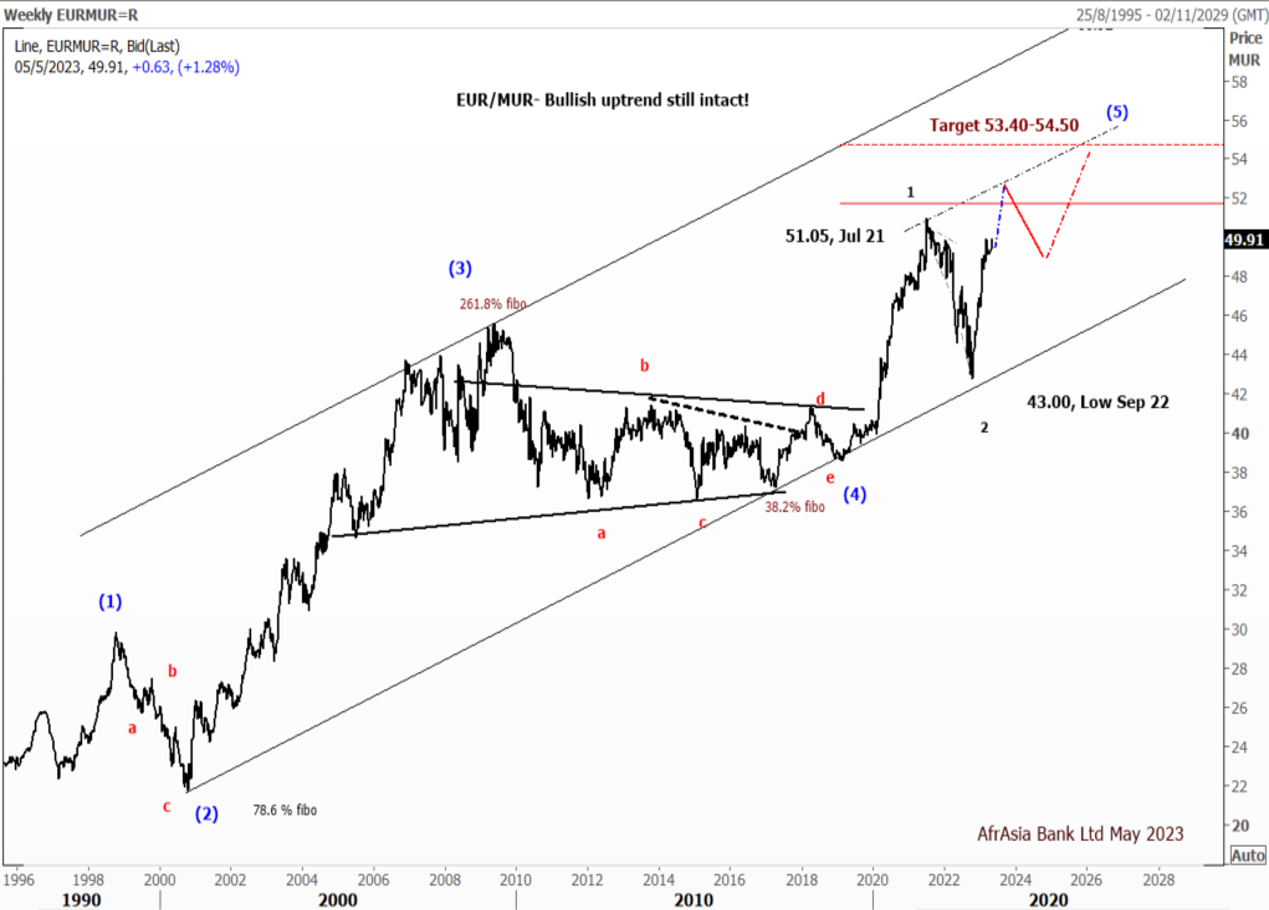
Forecast
EUR/MUR- On the weekly chart, the EUR/MUR may extend its rally in the short term above the high of 51.05 printed in July 2021.
From a technical perspective, on a break of the previous high at 51.05, the pair may find resistance at 52.00, followed by 52.50 by June 2023.
However, we expected the pair to pare some of its gains to 48.50 by September 2023 before a resumption of the uptrend to 53.40-54.50 by December 2023
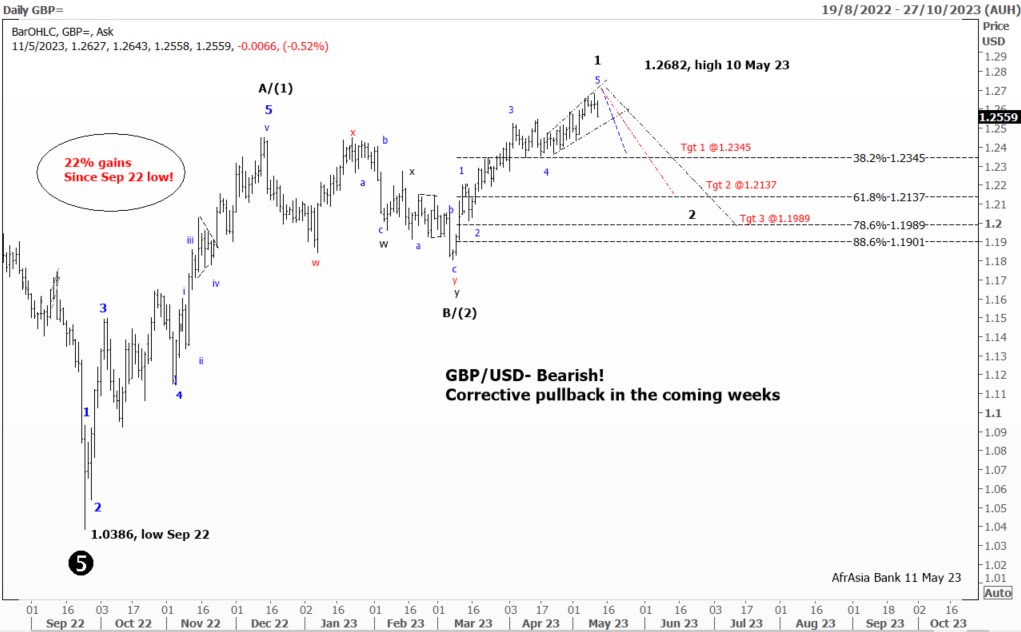
The Pound has bagged about 5.7% against the U.S. dollar this year to reach a 1-year high of $1.2682 on the 10th of May 2023 and is up some 17% from lows hit $1.0386 in the wake of September’s disastrous mini-budget.
From an Elliott Wave perspective, the GBP/USD remains in a long-term uptrend but could feel the pain of a corrective setback in the upcoming weeks. A break below the bullish trend channel at $1.2500 would open the door for further decline near $1.2345 (previous wave 4 of a lesser degree), followed by $1.2337 (61.8% Fibonacci retracement from a high of 1.2682), and lastly at $1.1900 (78.6% Fibonacci retracement). On the upside, stiff resistance has formed at 1.2645 and 1.2680 could be seen as the next bullish target.

