Internet Banking
Click icon again to close

Treasury

Daily Market Patrol

Market Patrol 3 August 2020

A problem is a chance for you to do your best

Duke Ellington
Indicative Selling Rates
against MUR
USD
16 Apr 2024
  • AUD
  • 30.59
  • 0.6481
  • BWP
  • 3.48
  • 0.0737
  • CAD
  • 34.48
  • 1.3688
  • CNY
  • 6.61
  • 7.1388
  • DKK
  • 6.81
  • 6.9264
  • EUR
  • 50.34
  • 1.0666
  • HKD
  • 6.12
  • 7.7125
  • INR
  • 0.57
  • 82.2137
  • JPY
  • 30.94
  • 152.5741
  • KES
  • 36.67
  • 128.7205
  • NZD
  • 28.01
  • 0.5934
  • NOK
  • 4.40
  • 10.7360
  • SGD
  • 34.89
  • 1.3527
  • ZAR
  • 2.56
  • 18.4391
  • SEK
  • 4.39
  • 10.7602
  • CHF
  • 52.03
  • 1.1023
  • GBP
  • 58.96
  • 1.2491
  • USD
  • 47.20
  • 1.0000
  • AED
  • 13.05
  • 3.6156
The Shared currency tumbled after the euro zone's economy recorded its deepest contraction on record in the second quarter.
Fundamental News

EUR/USD
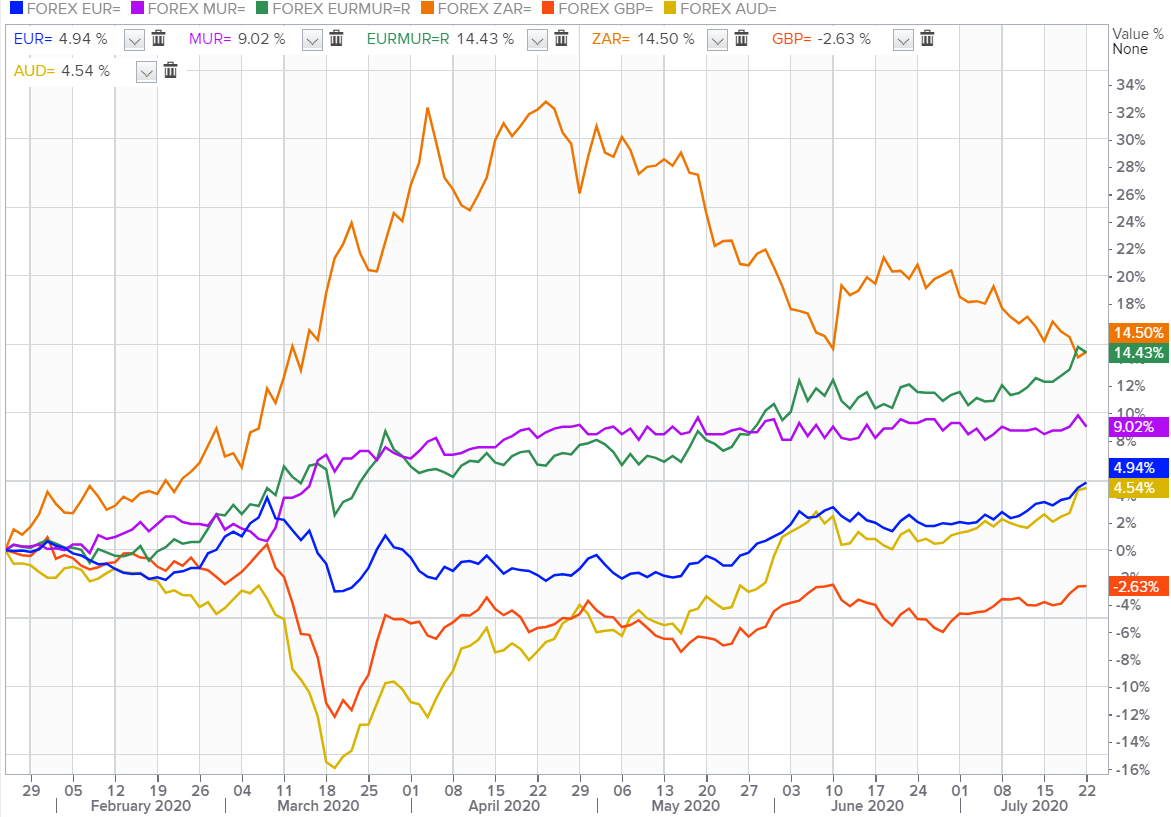
The Single currency tumbled from Friday's high of $1.1905 to $1.1750 this morning after the euro zone's economy recorded its deepest contraction in Q2 GDP.


GBP/USD
The Pound snapped from a five-month high of $1.3164 to $1.3055 this morning on fears of a no-deal Brexit combined with a broad U.S. dollar strength. Major attention has now shifted to Bank Of England's rate decision on Thursday.


USD/JPY
The Japanese Yen nosedived to 105.90 against the greenback unbothered by upbeat Japan's GDP figures.


AUD/USD
The Aussie dollar slipped to $0.7140 on risk aversion after the state of Victoria set curfew to curb COVID-19.


USD/ZAR
South Africa's rand slumped to 17.15 versus the greenback as investors' hope for a global recovery was dented by a sharp contraction in the U.S. and European economies.


USD/MUR
The pair remained unchanged at 40.25(selling) on the local market.

Fundamental & Technical Data
Economic Indicators-Local Time

12:30 - GBP - Manufacturing PMI (Jul)

18:00 - USD - ISM Manufacturing PMI (Jul)


Central Bank Interest Rates
Last Change
New Meeting
Federal Bank of U.S
0.00-0.25%
16-Mar-2020
14-Sep-2020
European Central Bank
0.00%
10-Mar-2016
10-Sep-2020
Bank of England
0.10%
19-May-2020
06-Aug-2020
Bank of Japan
-0.10%
28-Jan-2016
17-Sep-2020
Reserve Bank of Australia
0.25%
18-Mar-2020
04-Aug-2020
S.Africa Reserve Bank
3.50%
23-Jul-2020
17-Sep-2020
Reserve Bank of India
4.00%
22-May-2020
06-Aug-2020
Bank of Mauritius
1.85%
16-Apr-2020
-
Looking for Markets correlation?
Market Correlation is a measure, statistical or observational, that gives a positive or negative link between the pricing of multiple currencies.

Bulls & Bears Levels
Resistance and Support
Levels
EUR/USD
GBP/USD
USD/JPY
USD/ZAR
R3
1.2014
1.3309
108.47
17.54
R2
1.1961
1.3206
107.27
17.40
R1
1.1867
1.3151
106.60
17.21
PP
1.1814
1.3048
105.40
16.40
S1
1.1720
1.2992
104.73
16.32
S2
1.1667
1.2889
103.53
16.17
S3
1.1573
1.2834
102.86
16.00
Technical Analysis - Forex Charts
Japanese Yen may flirt to 105.30/19/dlr, further underscoring what may appear to be a buoyant month.
Chart updated on 24.07.2020

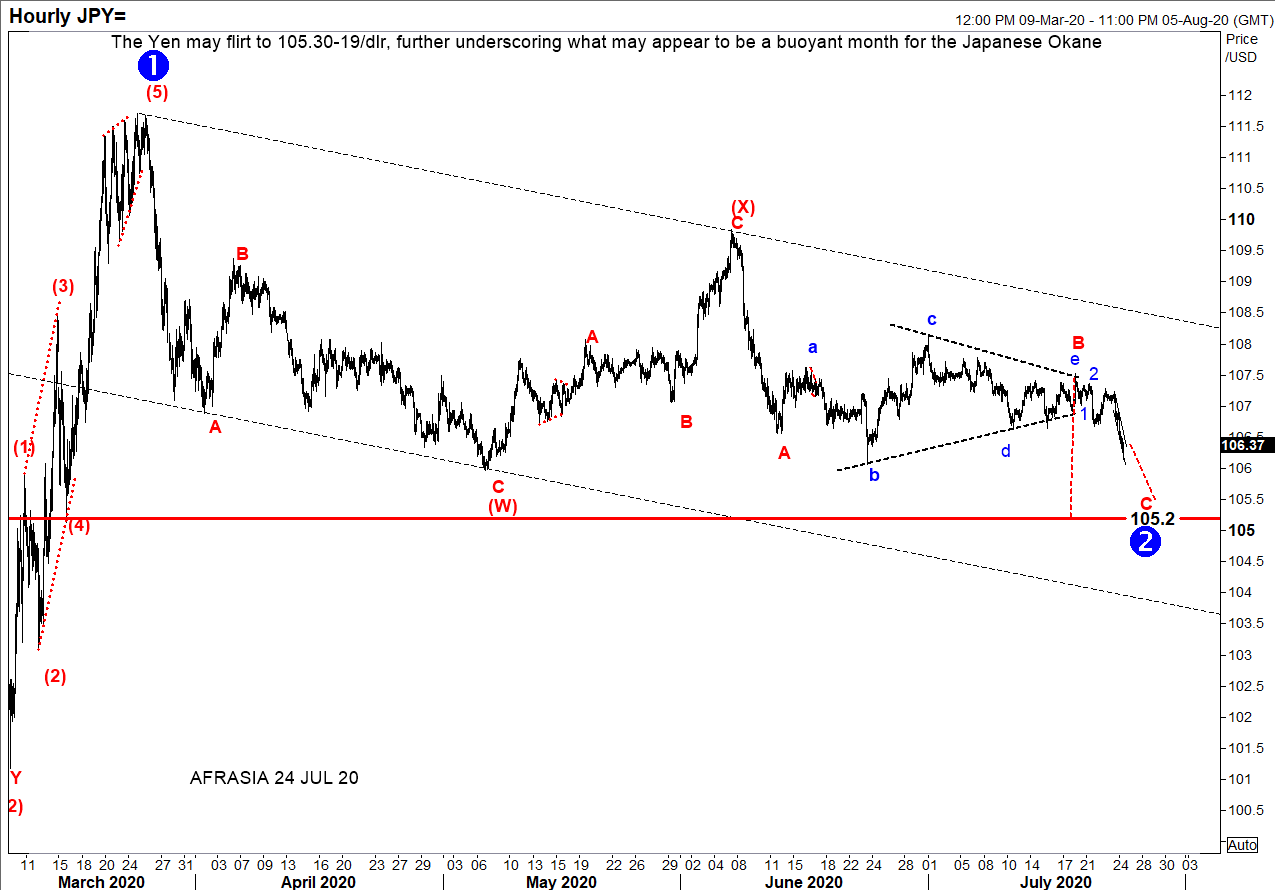
After rallying from bottoming all time low at 101.20 to 111.71 in covid-fueled March period, dwarfing an expanding leading diagonal ((1)) in 5 waves, USD/JPY has ever since unfolded in a corrective double three combination pattern (W)-(X)-(Y) of wave ((2)).


From an Elliott Wave trading standpoint, the pair may experience further decline to the choppy downside to complete countertrend wave (Y) because- An impulse usually retraces to at least wave (4) of previous smaller trend, that is 105.19.
- Wave (4) of wave ((1)) coincides with 61.8% Fibonnacii retracement of wave ((1)), i.e 105.19.
- 78.6% projection wave (W) through (X) targets level 105.30.
- In EW lexicon, a pullback to the previous wave (2) usually happen to a leading diagonal ((1)).
- Post-triangle thrust measurement of wave B of (Y) leads exactly to 105.20.
- USD/JPY is still trading within the bearish parellel trendlines.


Thus, hibernation of price action could be seen in the locality of 105.30/19.On the flipside, a violent recoil to revive bullish momentum at 109.84 of June 4th would nullify this set-up, warning that the potency of positioning-derived bearish signal may be ebbing.


USD/CAD - Early stage of a bullish run.
Chart posted on 24.07.2020

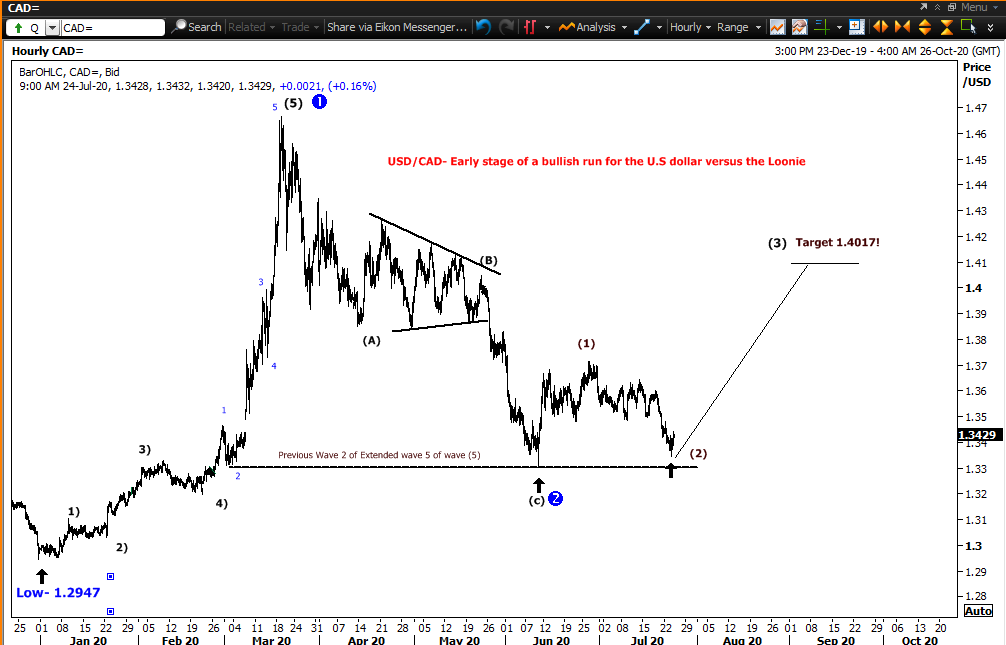
On the hourly Chart, The USD/CAD has found strong support again near $1.3350 region yesterday. The pair fell to as low as $1.3345 before bouncing off relentlessly to as high as $1.3444 this morning.


We feel that the USD/CAD could be in an early stage of a bullish run towards $1.4017 in the coming months.


On the downside, $1.3315 remains a strong baseline , while  a break below that level would open the door for further weakness on the USD/CAD near $1.3200.

Markey update on Biz Week by Christie Ng
Speak to our team
  • Allan Juste
    Head - Forex And Derivatives
    +230 5251 4855
  • Reshma Peerun Rajwani
    Head – Treasury Sales
    +230 403 5500
Disclaimer
Please note that the information published is purely indicative. It is based on technical data from sources which the Bank verily believes to be authentic, though its timeliness or accuracy cannot be warranted or guaranteed. AfrAsia Bank Ltd issues no invitation to anyone to rely on this bulletin and neither we nor our information providers shall be in no way whatsoever, liable for any errors or inaccuracies, regardless of cause, or the lack of timeliness, or for any delay or interruption in the transmission thereof to the user. The indicative rates and other market information are subject to changes at the Bank's discretion. Whilst every effort is made to ensure the information is accurate, you should confirm the latest situation with the Bank prior to making any decisions.