Internet Banking
Click icon again to close

Treasury

Daily Market Patrol

Market Patrol 29 July 2020

Believe you can and you're halfway there.

Theodore Roosevelt
Indicative Selling Rates
against MUR
USD
19 Apr 2024
  • AUD
  • 30.42
  • 0.6459
  • BWP
  • 3.47
  • 0.0737
  • CAD
  • 34.46
  • 1.3664
  • CNY
  • 6.60
  • 7.1402
  • DKK
  • 6.82
  • 6.9093
  • EUR
  • 50.34
  • 1.0691
  • HKD
  • 6.10
  • 7.7148
  • INR
  • 0.57
  • 82.1874
  • JPY
  • 30.85
  • 152.6385
  • KES
  • 35.97
  • 130.9049
  • NZD
  • 27.96
  • 0.5937
  • NOK
  • 4.35
  • 10.8251
  • SGD
  • 34.91
  • 1.3490
  • ZAR
  • 2.53
  • 18.6446
  • SEK
  • 4.35
  • 10.8361
  • CHF
  • 52.18
  • 1.1081
  • GBP
  • 58.79
  • 1.2484
  • USD
  • 47.09
  • 1.0000
  • AED
  • 13.02
  • 3.6162
U.S Dollar on the back foot as corona virus pandemic kept Congress and the Federal Reserve in a bind.
Fundamental News

EUR/USD

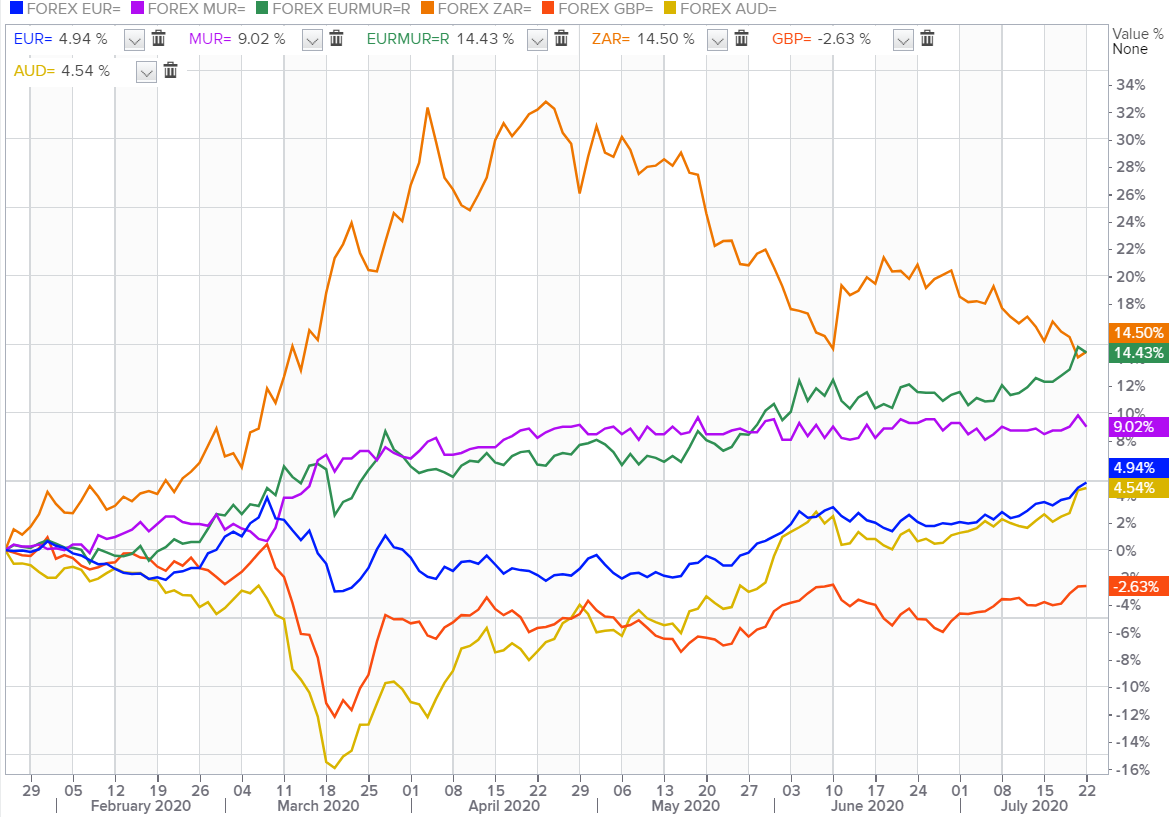
The Shared currency strengthened to $1.1750 amid concerns ranging from the delay of a stimulus package in the United States, rising coronavirus cases, and tensions with China.


GBP/USD

The Sterling held on to a four-month high at $1.2920 on a broad U.S. dollar weakness and despite negative news from Brexit negotiations.


USD/JPY

The Japanese Yen gains remained unabated at 104.95 versus the greenback despite Rating agency Fitch on Wednesday lowered its outlook on Japan's long-term foreign currency debt rating to negative from stable.


AUD/USD

The Australian dollar rose to $0.7130 unaffected by record low second-quarter consumer prices, cementing views interest rates will stay low for a long time.


USD/ZAR

South Africa's hovered near its high at 17.43 versus the U.S dollar as growing worries about the U.S economy had investors looking to the U.S. Federal Reserve tonight and Congress on Friday for a renewed commitment to endless stimulus.


USD/MUR
The Mauritian rupee stayed put at 40.15(selling) against the dollar.

Fundamental & Technical Data
Economic Indicators-Local Time

12:00 - ZAR - CPI (MoM) (Jun)

18:00 - USD - Pending Home Sales (MoM) (Jun)

18:30 - USD - Crude Oil Inventories

22:00 - USD - Fed Interest Rate Decision

22:00 - USD - FOMC Statement 

22:30 - USD - FOMC Press Conference 

Central Bank Interest Rates
Last Change
New Meeting
Federal Bank of U.S
0.00-0.25%
16-Mar-2020
29-Jul-2020
European Central Bank
0.00%
10-Mar-2016
10-Sep-2020
Bank of England
0.10%
19-May-2020
06-Aug-2020
Bank of Japan
-0.10%
28-Jan-2016
17-Sep-2020
Reserve Bank of Australia
0.25%
18-Mar-2020
04-Aug-2020
S.Africa Reserve Bank
3.50%
23-Jul-2020
17-Sep-2020
Reserve Bank of India
4.00%
22-May-2020
06-Aug-2020
Bank of Mauritius
1.85%
16-Apr-2020
-
Looking for Markets correlation?
Market Correlation is a measure, statistical or observational, that gives a positive or negative link between the pricing of multiple currencies.

Bulls & Bears Levels
Resistance and Support
Levels
EUR/USD
GBP/USD
USD/JPY
USD/ZAR
R3
1.1947
1.3051
106.98
16.79
R2
1.1864
1.2977
106.56
16.58
R1
1.1808
1.2930
105.96
16.46
PP
1.1725
1.2856
105.54
16.40
S1
1.1669
1.2809
104.95
16.32
S2
1.1586
1.2735
104.52
16.17
S3
1.1530
1.2688
103.93
16.00
Technical Analysis - Forex Charts
Japanese Yen may flirt to 105.30/19/dlr, further underscoring what may appear to be a buoyant month.
Chart updated on 24.07.2020

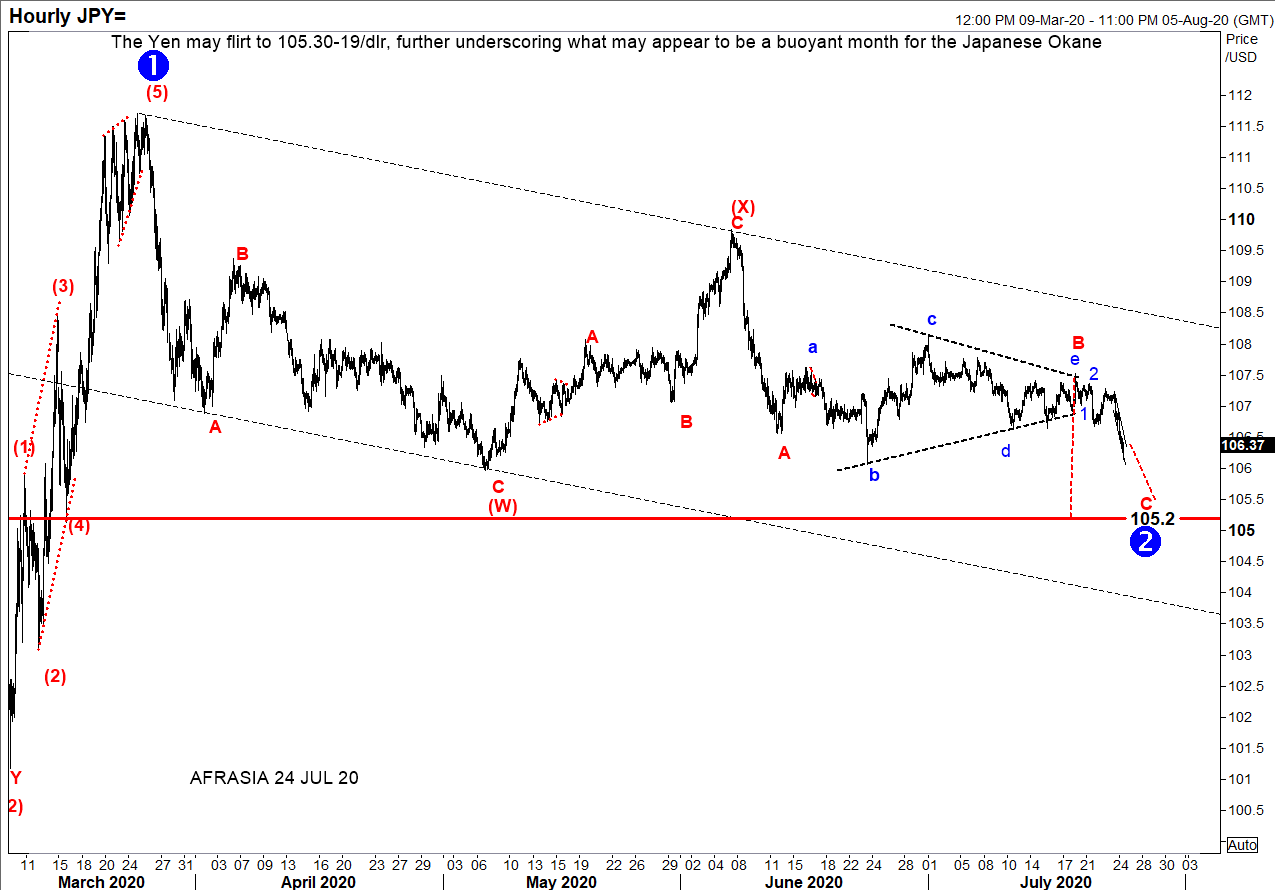
After rallying from bottoming all time low at 101.20 to 111.71 in covid-fueled March period, dwarfing an expanding leading diagonal ((1)) in 5 waves, USD/JPY has ever since unfolded in a corrective double three combination pattern (W)-(X)-(Y) of wave ((2)).


From an Elliott Wave trading standpoint, the pair may experience further decline to the choppy downside to complete countertrend wave (Y) because- An impulse usually retraces to at least wave (4) of previous smaller trend, that is 105.19.
- Wave (4) of wave ((1)) coincides with 61.8% Fibonnacii retracement of wave ((1)), i.e 105.19.
- 78.6% projection wave (W) through (X) targets level 105.30.
- In EW lexicon, a pullback to the previous wave (2) usually happen to a leading diagonal ((1)).
- Post-triangle thrust measurement of wave B of (Y) leads exactly to 105.20.
- USD/JPY is still trading within the bearish parellel trendlines.


Thus, hibernation of price action could be seen in the locality of 105.30/19.On the flipside, a violent recoil to revive bullish momentum at 109.84 of June 4th would nullify this set-up, warning that the potency of positioning-derived bearish signal may be ebbing.


USD/CAD - Early stage of a bullish run.
Chart posted on 24.07.2020

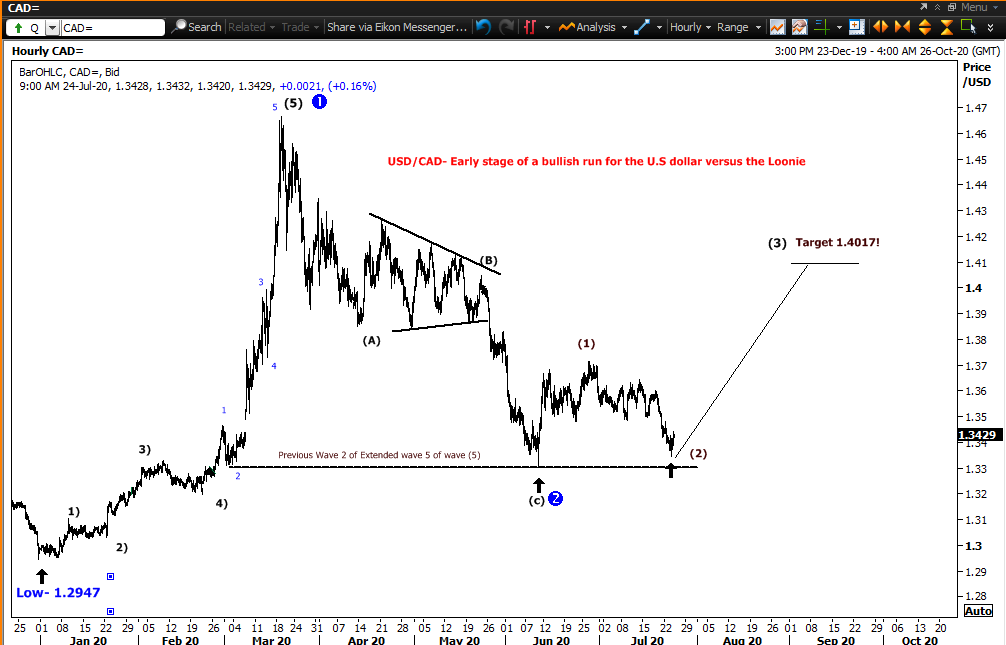
On the hourly Chart, The USD/CAD has found strong support again near $1.3350 region yesterday. The pair fell to as low as $1.3345 before bouncing off relentlessly to as high as $1.3444 this morning.


We feel that the USD/CAD could be in an early stage of a bullish run towards $1.4017 in the coming months.


On the downside, $1.3315 remains a strong baseline , while  a break below that level would open the door for further weakness on the USD/CAD near $1.3200.

Markey update on Biz Week by Christie Ng
Speak to our team
  • Allan Juste
    Head - Forex And Derivatives
    +230 5251 4855
  • Reshma Peerun Rajwani
    Head – Treasury Sales
    +230 403 5500
Disclaimer
Please note that the information published is purely indicative. It is based on technical data from sources which the Bank verily believes to be authentic, though its timeliness or accuracy cannot be warranted or guaranteed. AfrAsia Bank Ltd issues no invitation to anyone to rely on this bulletin and neither we nor our information providers shall be in no way whatsoever, liable for any errors or inaccuracies, regardless of cause, or the lack of timeliness, or for any delay or interruption in the transmission thereof to the user. The indicative rates and other market information are subject to changes at the Bank's discretion. Whilst every effort is made to ensure the information is accurate, you should confirm the latest situation with the Bank prior to making any decisions.