
Power is taking action in a moment that could make you feel powerless.
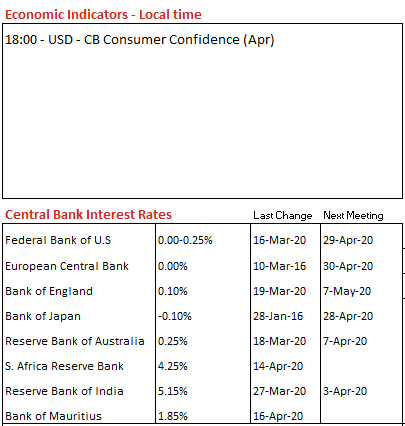
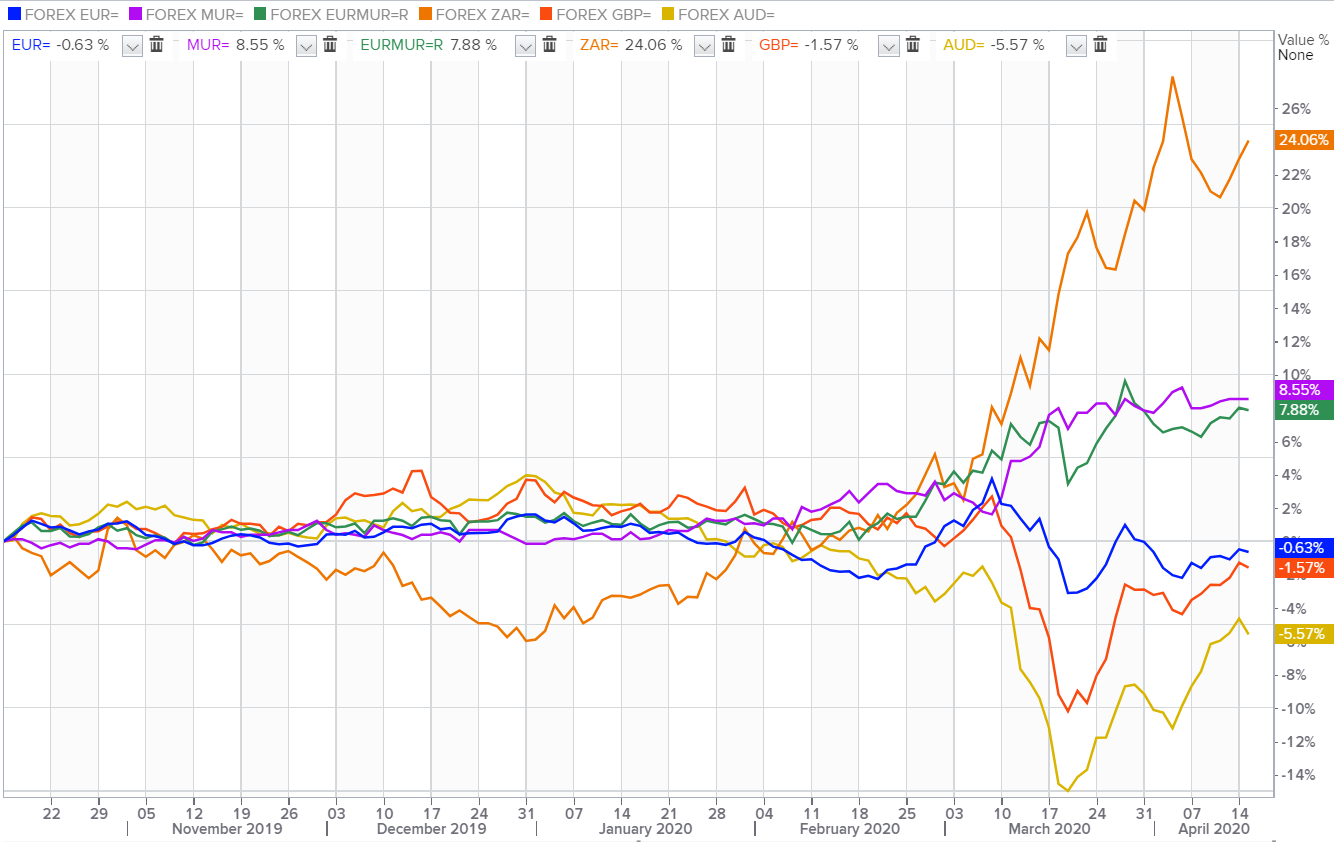
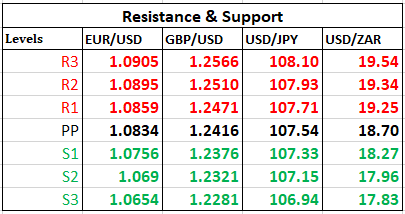
USD
EUR/USD
The single currency edged back to $1.0819 as traders refrained from taking big positions ahead of monetary policy meetings by Federal Reserve and the European Central Bank along with first quarter GDP numbers scheduled for release.
GBP/USD
The cable stepped back to $1.2415 on fears of the UK’s coronavirus resurgence and allegations over the Tory government's mishandling of COVID-19 keep flooding.
USD/JPY
The yen trapped within a 15-pips band around 107.25/3 against the greenback amid uncertainty over the oil price war and brewing US-China tensions over the latter’s coronavirus response.
AUD/USD
The Aussie firmed at $0.6460 as investors continued to cheer the country's progress in containing the virus.
USD/ZAR
The South African rand rallied to 18.78 per dollar despite South African financial markets closed on Monday.
USD/MUR
The pair idled to 40.40(selling) on the domestic market.

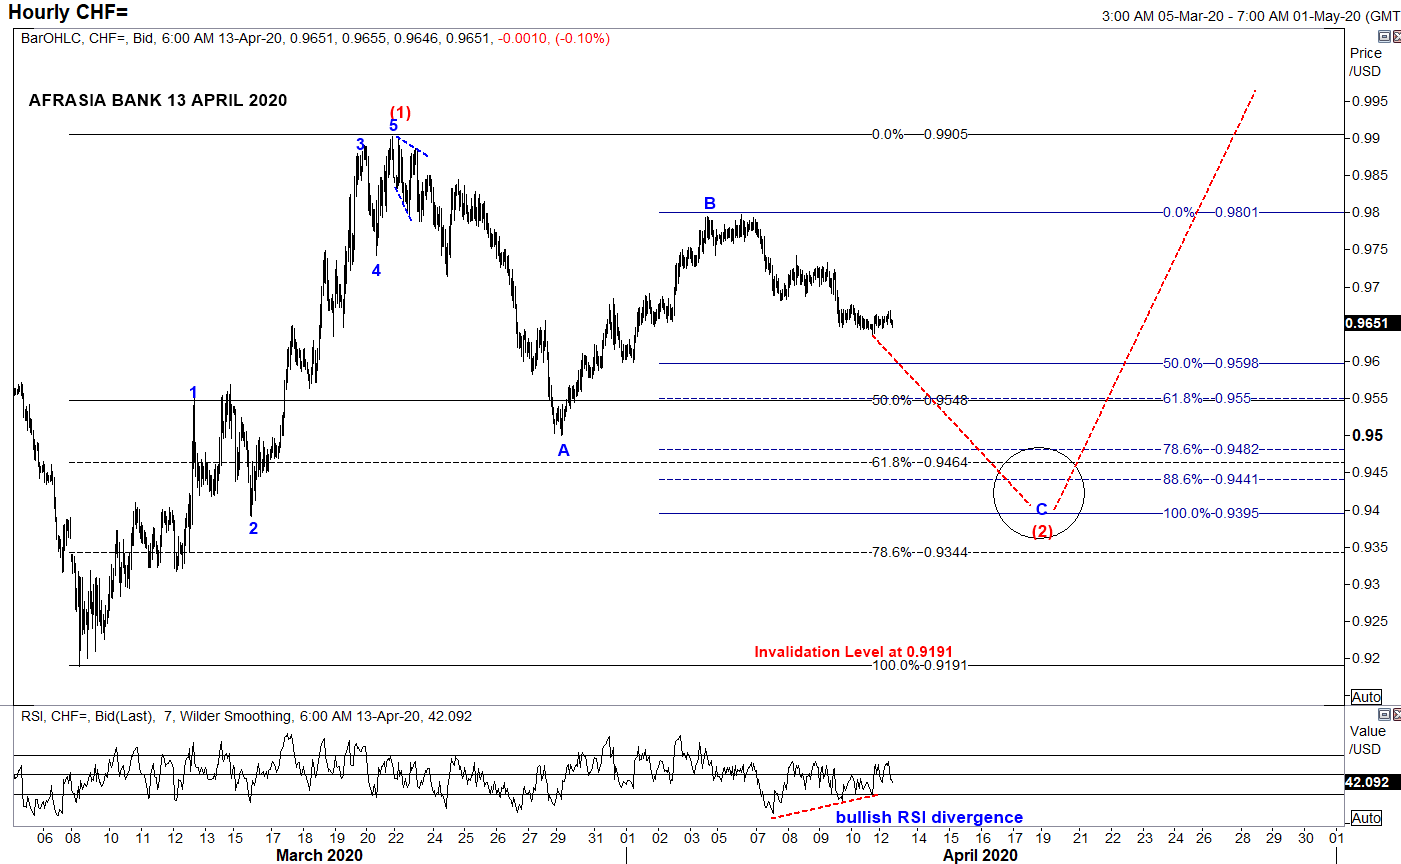
- From an Elliott Wave standpoint, USDCHF could potentially unfold into compelling impulsive Wave C of the zigzag correction of Wave (2) to a narrowing region 0.9550 (50% retracement of Wave (1)) to 0.9395 (100% projection of Wave A through B) in the near term trend, from the downside bias from April 6th high of 0.9797.
- Price could immediately start to shoot back up into Wave (3) on a longer perspective.
- Piercing above the resistance 0.9905 would endorse the structure.
- Alternatively, broader bearish invalidation of Elliott Wave Structure rest at 0.9191 of March 9th low while Relative Strength Index signals a bullish recoil higher for the pair.
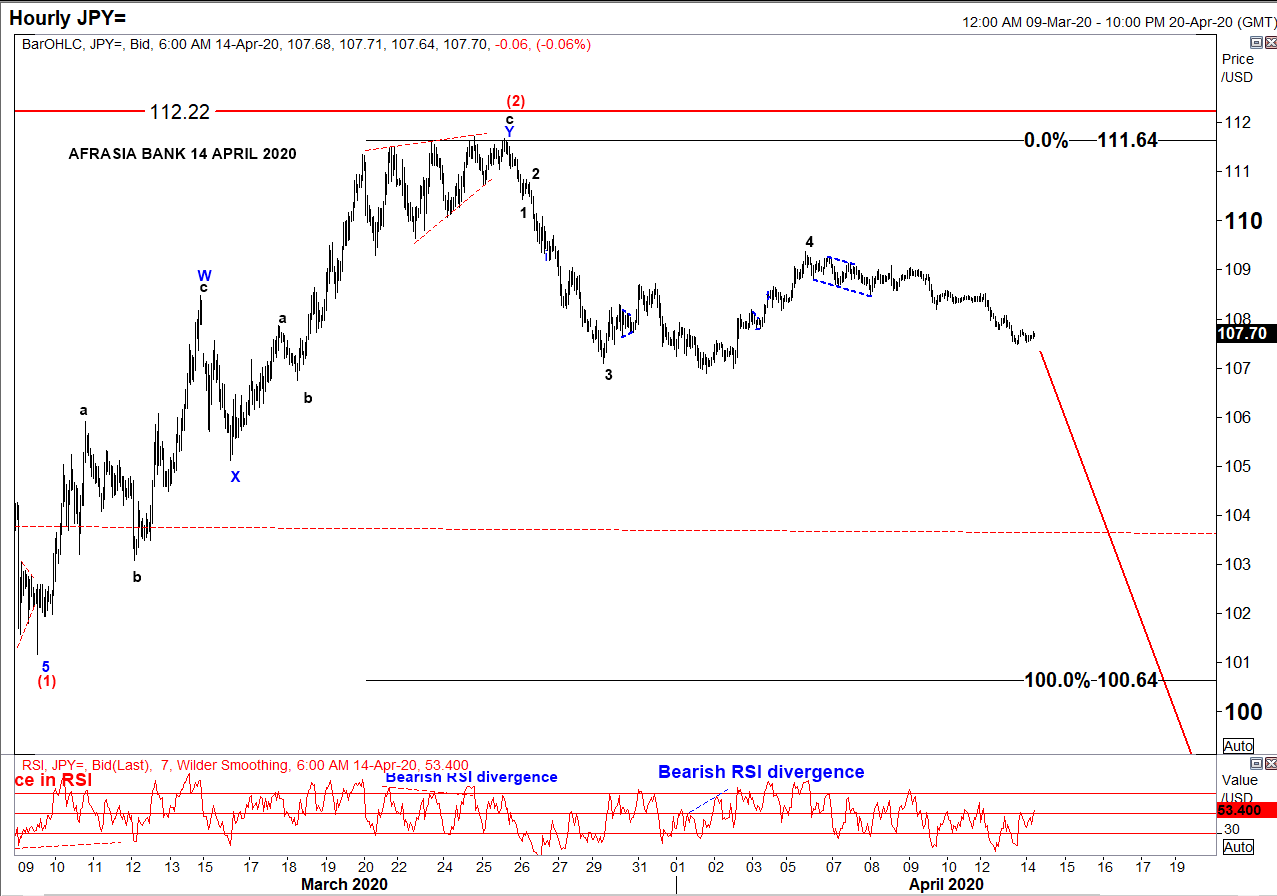
• After rallying to the downside from a high of 112.22 to 101.17 amid global pandemic threat, USD/JPY has been in a correcting mode since 9th March 2020 and seemed to have recently completed an W-X-Y Double Zig-Zag structure of Wave (2) reaching a high of 111.64 on 27th March 2020.
• Two strong indicators were flashing a trend reversal: ending diagonal at Wave 5 of Wave c and bearish RSI divergence.
• On the hourly chart, as per Elliott Wave analysis, the pair might resume its downwards trend targeting 100.64 - 93.78 to unfold Wave (3), a projection of 100%-161.8% of Fibonacci level.
• At 107.70 today, USD/JPY is percolating towards its target from 110.41 to 107.84, as per chart.
• On a side note, resumption of a bullish USD/JPY would mark an invalidation of the Elliott Wave structure above 112.22

