
All our dreams can come true, if we have the courage to pursue them
USD
EUR/USD
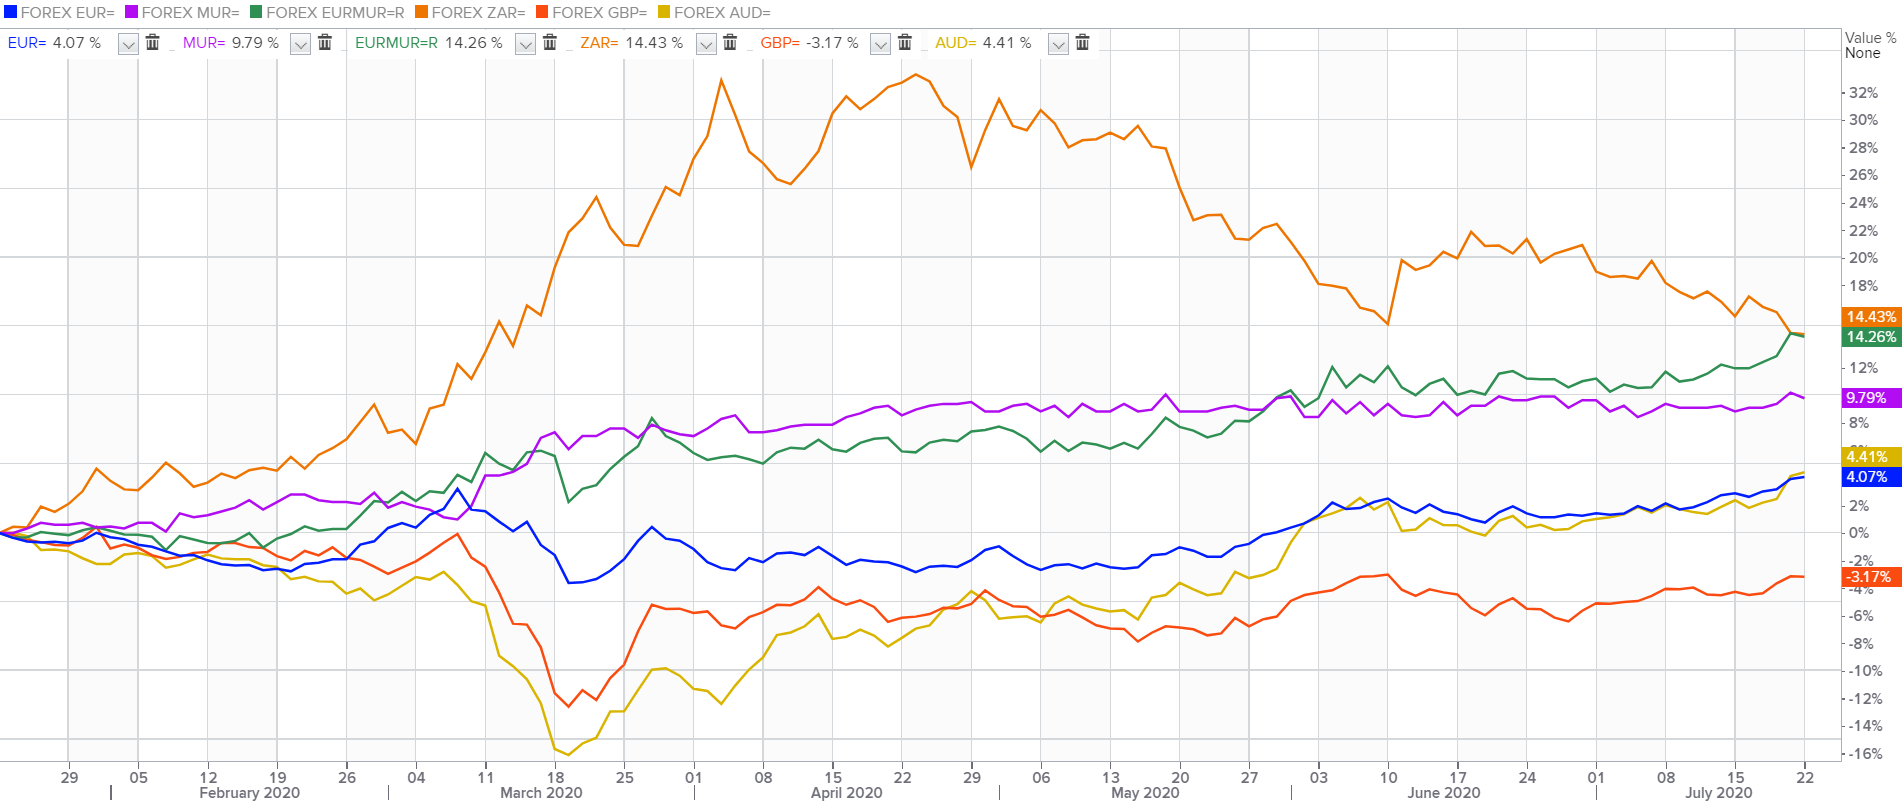
The Single currency rose to its highest since October 2018 at $1.1600 as the European Union’s agreement on stimulus spurred renewed demand for the region’s assets.
GBP/USD
The British pound steadied at $1.2740 on the growing concern that the Brexit transition period will end without a deal between Britain and the EU.
USD/JPY
The Japanese yen meandered at 107.15 against the greenback as heightened Sino-U.S. tensions kept currency markets cautious.
AUD/USD
The Aussie climbed to a 16-month peak at $0.7184 on Wednesday on positive risk sentiment but gave up ground slightly to $0.7157 this morning.
USD/ZAR
The South African rand hit a one-and-a-half month peak at 16.33/dlr on Wednesday, as risk appetite improved in the currency markets, shrugging off data showing a plunge in local retail sales because of the coronavirus lockdown.
USD/MUR
The dollar-rupee inched up by 5 cents to 40.40(selling) on the domestic market.
16:30 - USD - Initial Jobless Claims
17:00 - ZAR - Interest Rate Decision (Jul)

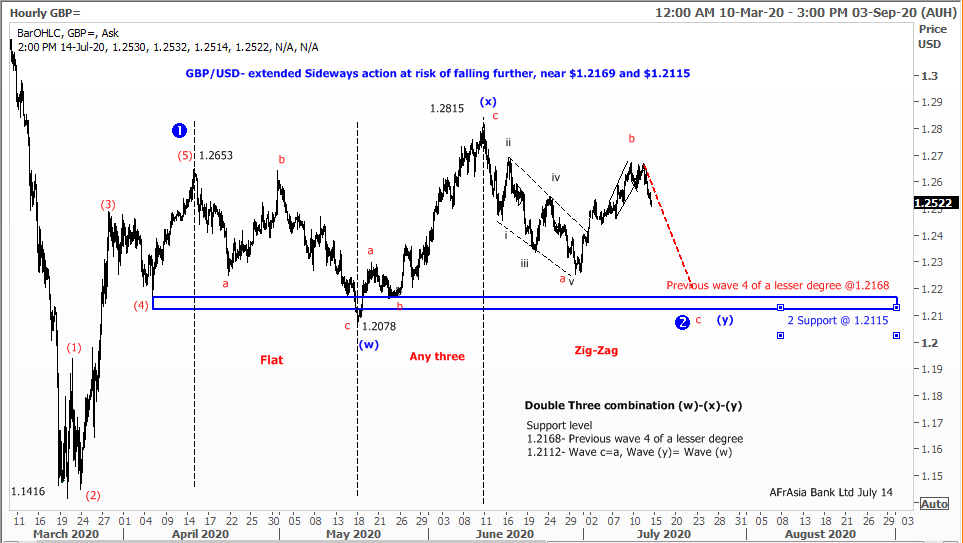
Double three combination- (W)-(X)-(Y)- targets to $1.2169 and $1.2115
From Mid-April 2020, the Pound appeared to be caught into a continuous range bound price movement of $1.2078 and $1.2815. Elliott called this type of extended sideways base pattern a double three combination of two corrective patterns. A combination is composed of simpler types of corrections pattern, including zig-zags, flats and triangles. The simple corrective pattern components are labeled W, Y and Z.
An inspection of the double three combination on the hourly chart suggests the following: Wave (w) from April 15th to May 15th form a flat correction, while the rise from $1.2078 to $1.2815 was wave (x).Wave (y) is still unfolding into a possible Zig-Zag correction. It is likely that two corrective waves( a and b) of the Zig-Zag may have been completed at this juncture and that the market is in the process of tracing out Wave c of wave(y).
In the short term, Wave c of wave (y) could bottom at $1.2169 (within the area of the fourth wave of a lesser degree). While $1.2115 could prove as good alternative support based on typical ratio analysis guideline( Wave c=a, Wave (y)=(w)).
On the other hand ,any upside reversal would depend upon a break of $1.2665/70 area comprising highs market on last Thursday and on Monday. A successful break at $1.2670 would open the door for June month top near $1.2815.
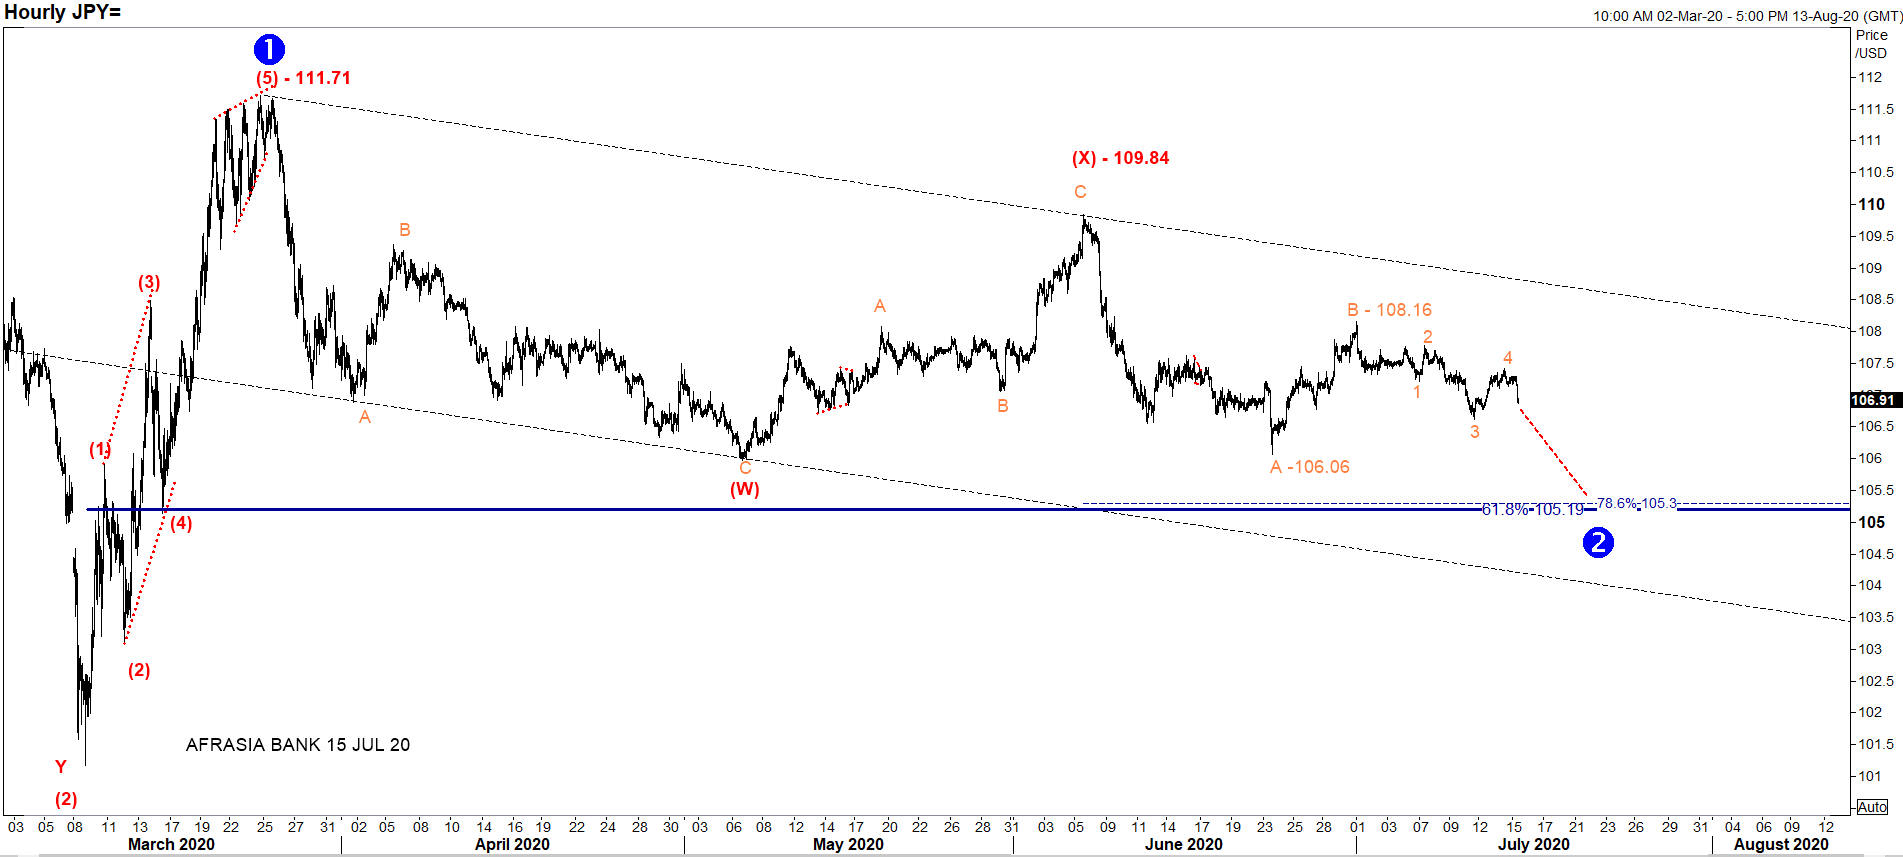
After rallying from bottoming all time low at 101.20 to 111.71 in covid-fueled March period, dwarfing an expanding leading diagonal ((1)) in 5 waves, USD/JPY has ever since unfolded in a corrective double three combination pattern (W)-(X)-(Y) of wave ((2)).
From an Elliott Wave trading standpoint, the pair may experience further decline to the choppy downside to complete countertrend wave (Y) because
- An impulse usually retraces to at least wave (4) of previous smaller trend, that is 105.19.
- Wave (4) of wave ((1)) coincides with 61.8% Fibonnacii retracement of wave ((1)), i.e 105.19.
- 78.6% projection wave (W) through (X) targets level 105.30.
- In EW lexicon, a pullback to the previous wave (2) usually happen to a leading diagonal ((1)).
- USD/JPY is still trading within the bearish parellel trendlines.
Thus, hibernation of price action could be seen in the locality of 105.30/19.
On the flipside, a violent recoil to revive bullish momentum at 109.84 of June 4th would nullify this set-up, warning that the potency of positioning-derived bearish signal may be ebbing.

