
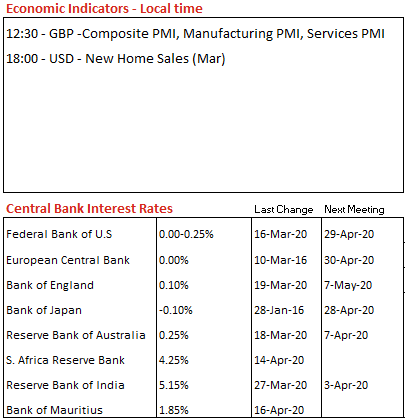
Simplicity is the ultimate sophistication.
USD
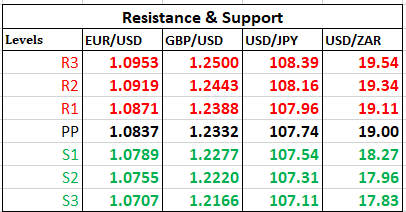
EUR/USD
The fiber cascaded to $1.0824 as European Union leaders’ Summit scheduled later today via video conferencing is closely eyed, as they seek to mitigate the economic risks induced by the virus pandemic.
GBP/USD
The cable inched higher to $1.2360, driven by a report showing Britain's inflation rate dropped in March.
USD/JPY
The yen sidelined at 107.80 per dollar on a rebound in crude prices from an unprecedented collapse partially calmed markets unnerved by the massive coronavirus-led drop in global demand.
AUD/USD
The Aussie bounced back to $0.6350, hit by Australian Services PMI falling to 19.6 but benefited from a surge in exports in March.
USD/ZAR
The South African rand lifted to 18.95 against the greenback as optimism over the 500 billion rand ($26.41 billion) rescue package announced by President Cyril Ramaphosa on Tuesday gave way to concerns about economic growth.
USD/MUR
The pair edged lower by 10 cents to 40.30(selling) on the domestic market after the Bank of Mauritius' intervention to sell dollars.

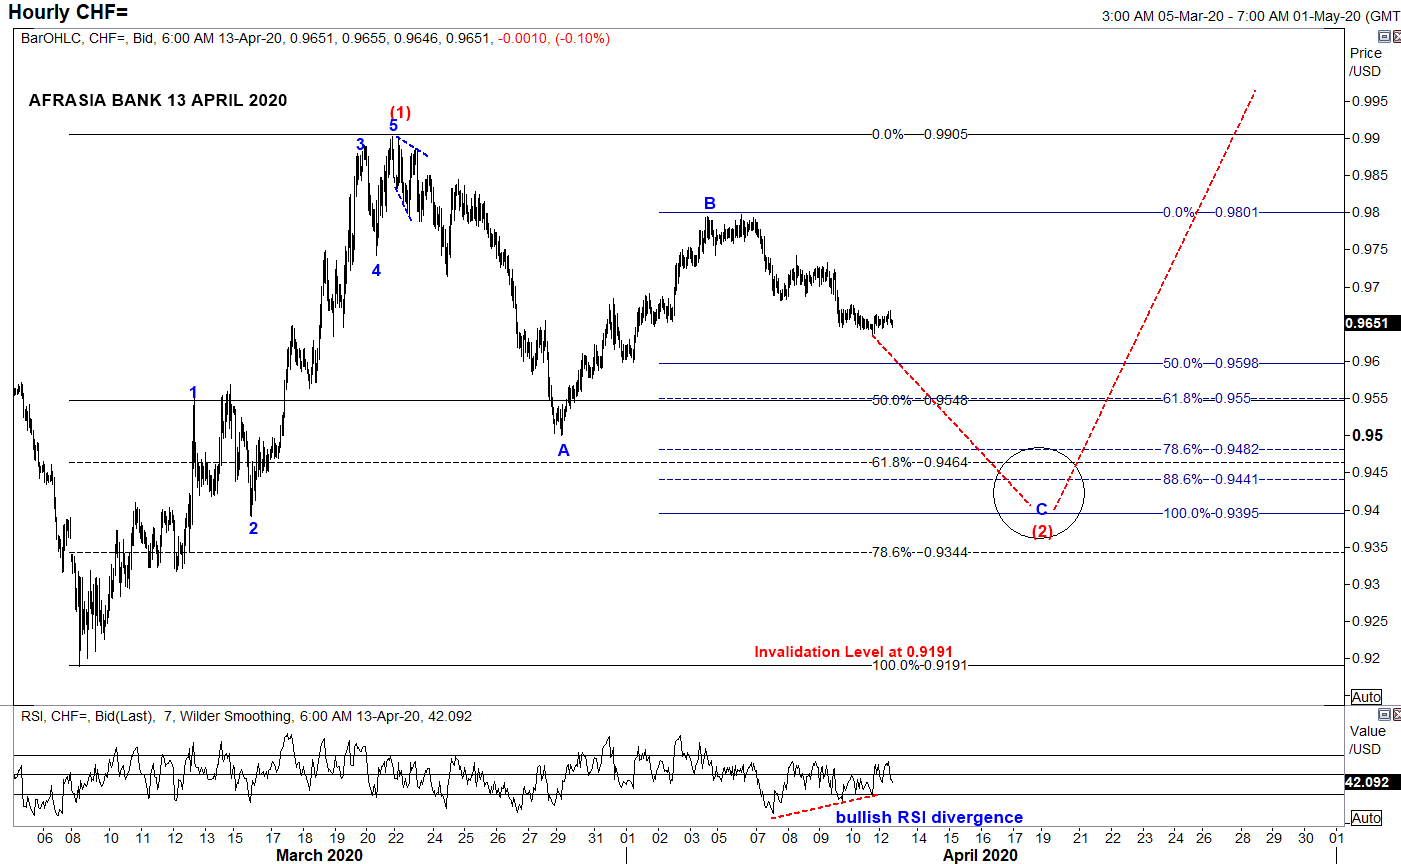
- From an Elliott Wave standpoint, USDCHF could potentially unfold into compelling impulsive Wave C of the zigzag correction of Wave (2) to a narrowing region 0.9550 (50% retracement of Wave (1)) to 0.9395 (100% projection of Wave A through B) in the near term trend, from the downside bias from April 6th high of 0.9797.
- Price could immediately start to shoot back up into Wave (3) on a longer perspective.
- Piercing above the resistance 0.9905 would endorse the structure.
- Alternatively, broader bearish invalidation of Elliott Wave Structure rest at 0.9191 of March 9th low while Relative Strength Index signals a bullish recoil higher for the pair.
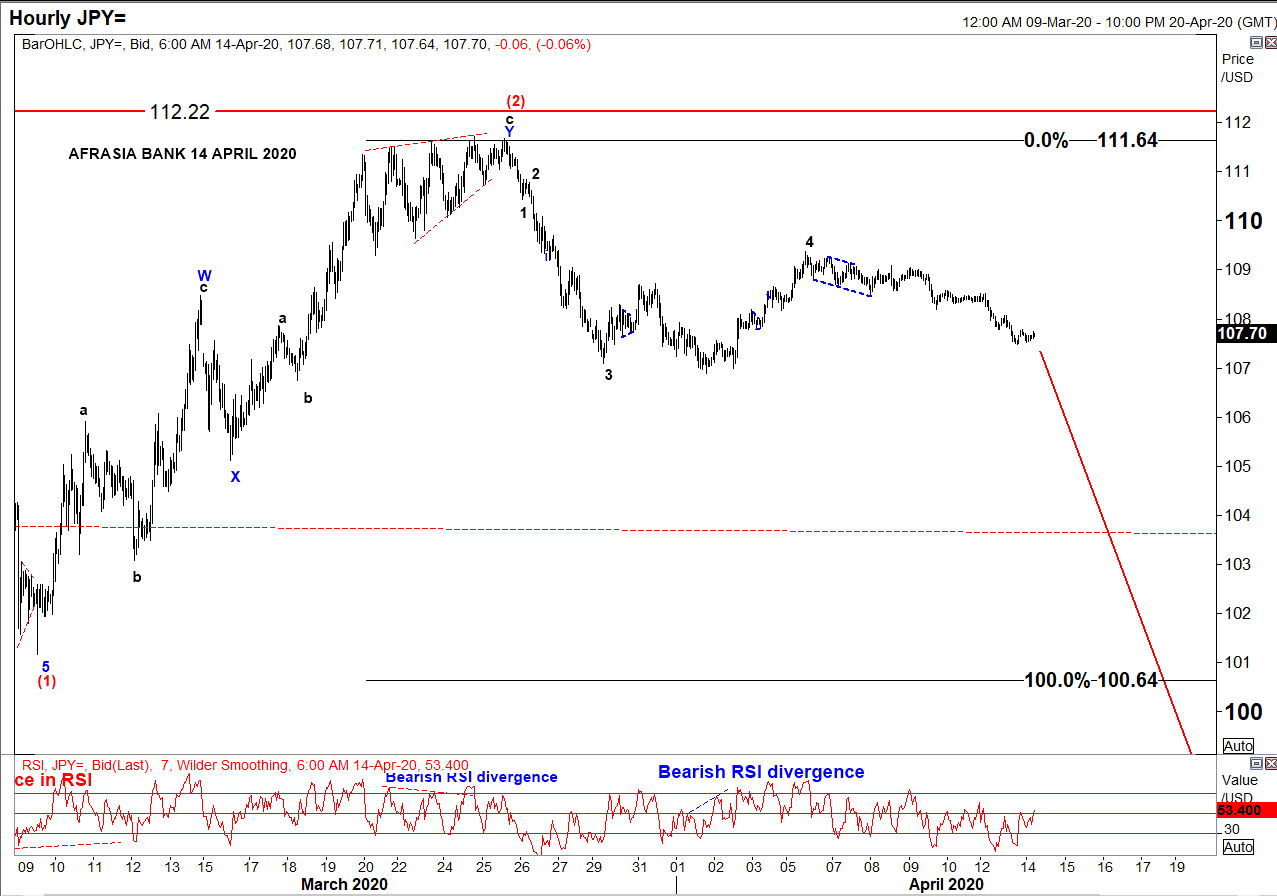
• After rallying to the downside from a high of 112.22 to 101.17 amid global pandemic threat, USD/JPY has been in a correcting mode since 9th March 2020 and seemed to have recently completed an W-X-Y Double Zig-Zag structure of Wave (2) reaching a high of 111.64 on 27th March 2020.
• Two strong indicators were flashing a trend reversal: ending diagonal at Wave 5 of Wave c and bearish RSI divergence.
• On the hourly chart, as per Elliott Wave analysis, the pair might resume its downwards trend targeting 100.64 - 93.78 to unfold Wave (3), a projection of 100%-161.8% of Fibonacci level.
• At 107.70 today, USD/JPY is percolating towards its target from 110.41 to 107.84, as per chart.
• On a side note, resumption of a bullish USD/JPY would mark an invalidation of the Elliott Wave structure above 112.22

