Internet Banking
Click icon again to close

Treasury

Daily Market Patrol

Market Patrol 20 May 2020

To live well is to work well, to show a good activity.

Thomas Aquinas
Indicative Selling Rates
against MUR
USD
19 Apr 2024
  • AUD
  • 30.42
  • 0.6459
  • BWP
  • 3.47
  • 0.0737
  • CAD
  • 34.46
  • 1.3664
  • CNY
  • 6.60
  • 7.1402
  • DKK
  • 6.82
  • 6.9093
  • EUR
  • 50.34
  • 1.0691
  • HKD
  • 6.10
  • 7.7148
  • INR
  • 0.57
  • 82.1874
  • JPY
  • 30.85
  • 152.6385
  • KES
  • 35.97
  • 130.9049
  • NZD
  • 27.96
  • 0.5937
  • NOK
  • 4.35
  • 10.8251
  • SGD
  • 34.91
  • 1.3490
  • ZAR
  • 2.53
  • 18.6446
  • SEK
  • 4.35
  • 10.8361
  • CHF
  • 52.18
  • 1.1081
  • GBP
  • 58.79
  • 1.2484
  • USD
  • 47.09
  • 1.0000
  • AED
  • 13.02
  • 3.6162
U.S dollar pared some of its losses in New York last night on safe-haven USD buying after a Stat news report highlighted the lack of data in Moderna’s purported successful vaccine trial.
Fundamental News

EUR/USD
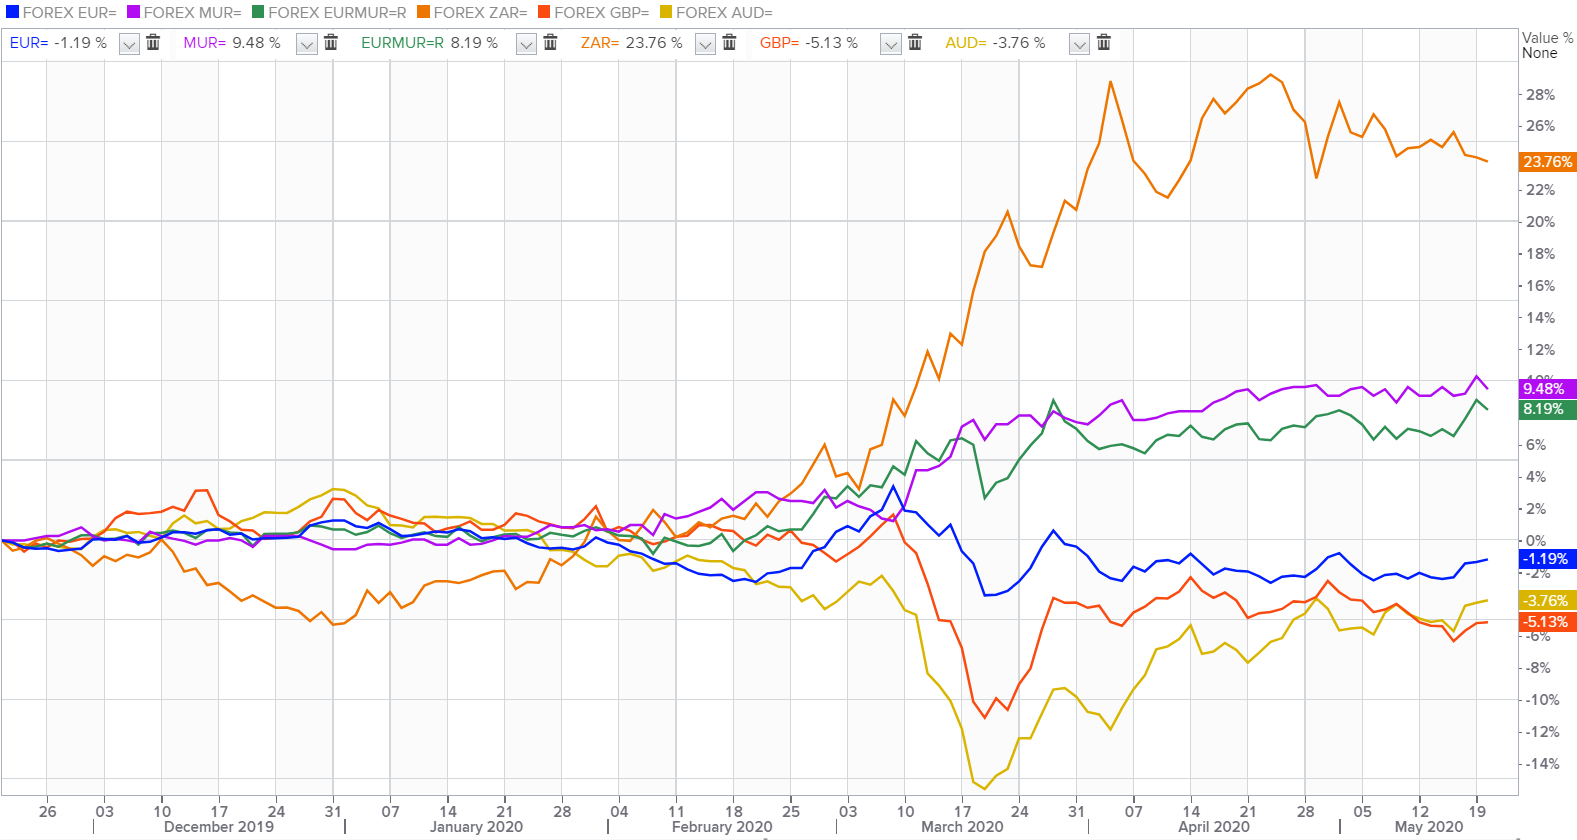
The single currency retreated to $1.0935 this morning after rallying to an intra-day high at $1.0976 in Europe yesterday on continued optimism over Franco-German proposal for a recovery fund together with upbeat German and EU ZEW sentiment data.


GBP/USD 
In the UK, the British Pound firmed at $1.2256 ahead of Consumer Price Index (CPI) for April month due today.


USD/JPY
The Yen sparked a broad slump to 108.00 level on Tuesday after Bank of Japan announced it will hold an emergency policy meeting on Friday( 0000 GMT) to sign off on a new lending program to helps firms combat the fallout from the coronavirus crisis.


AUD/USD
The Aussie held onto gains to $0.6545 despite a Bloomberg report showed China was considering targeting more Australian exports including wine, seafood, fruit, and dairy, adding to the 80% tariff imposed on barley and restrictions placed on meat from some of Australia’s largest abattoirs.


USD/ZAR
The Rand inched up to 18.33 per dollar, tracking higher commodity prices and spurred by optimism about the re-opening of economies around the world, amid SARB interest rate decision on Thursday. 


USD/MUR
On the domestic market, the USD/MUR unfazed at 40.30(selling).

Fundamental & Technical Data
Economic Indicators-Local Time

10:00 - GBP - CPI (YoY)(Apr)

13:00 - EUR - CPI (YoY)(Apr)

16:30 - CAD - Core CPI (MoM)(Apr)

17:30 - GBP - BoE Gov Bailey Speaks

18:30 - USD - Crude Oil Inventories

22:00 - USD - FOMC Meeting Minutes


Central Bank Interest Rates
Last Change
New Meeting
Federal Bank of U.S
0.00-0.25%
16-Mar-2020
10-Jun-2020
European Central Bank
0.00%
10-Mar-2016
04-Jun-2020
Bank of England
0.10%
19-May-2020
18-Jun-2020
Bank of Japan
-0.10%
28-Jan-2016
16-Jun-2020
Reserve Bank of Australia
0.25%
18-Mar-2020
02-Jun-2020
S.Africa Reserve Bank
4.25%
14-Apr-2020
21-May-2020
Reserve Bank of India
4.40%
27-Mar-2020
03-May-2020
Bank of Mauritius
1.85%
16-Apr-2020
-
Looking for Markets correlation?
Market Correlation is a measure, statistical or observational, that gives a positive or negative link between the pricing of multiple currencies.

Bulls & Bears Levels
Resistance and Support
Levels
EUR/USD
GBP/USD
USD/JPY
USD/ZAR
R3
1.1039
1.2417
108.89
19.54
R2
1.1008
1.2357
108.49
19.34
R1
1.0966
1.2305
108.10
19.17
PP
1.0934
1.2245
107.70
18.76
S1
1.0892
1.2193
107.31
18.58
S2
1.0860
1.2132
106.91
17.99
S3
1.0818
1.2080
106.52
17.81
Technical Analysis - Forex Charts
Safe-haven nature of FRANC SWISS may plummet USD/CHF to a downfall
Chart updated on 13.04.2020
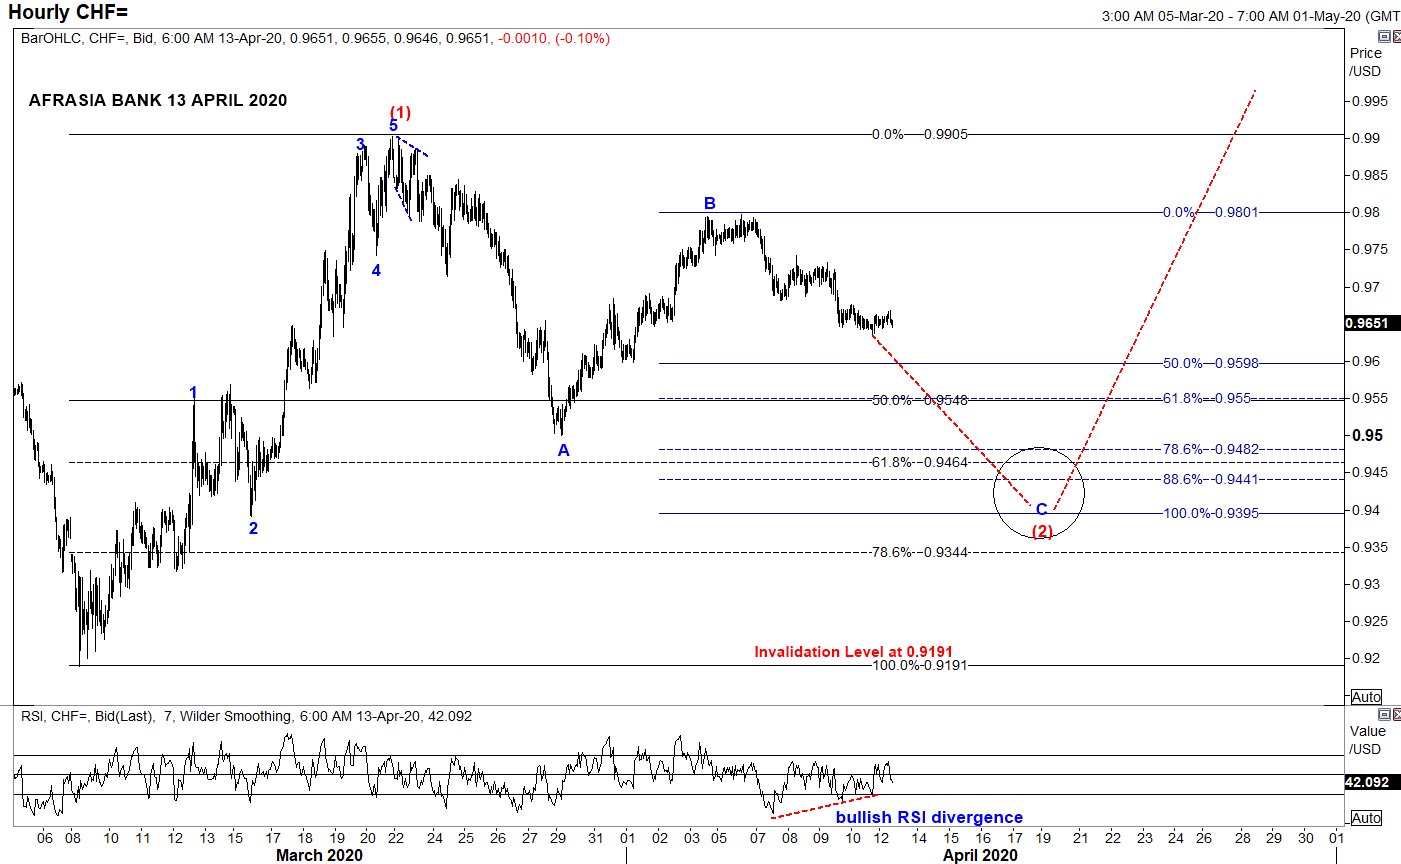
  • From an Elliott Wave standpoint, USDCHF could potentially unfold into compelling impulsive Wave C of the zigzag correction of Wave (2) to a narrowing region 0.9550 (50% retracement of Wave (1)) to 0.9395 (100% projection of Wave A through B) in the near term trend, from the downside bias from April 6th high of 0.9797.
  • Price could immediately start to shoot back up into Wave (3) on a longer perspective.
  • Piercing above the resistance 0.9905 would endorse the structure.
  • Alternatively, broader bearish invalidation of Elliott Wave Structure rest at 0.9191 of March 9th low while Relative Strength Index signals a bullish recoil higher for the pair.
Japanese Yen rebound may fizzle its way back to Safe-haven status
Chart posted on 14.04.2020

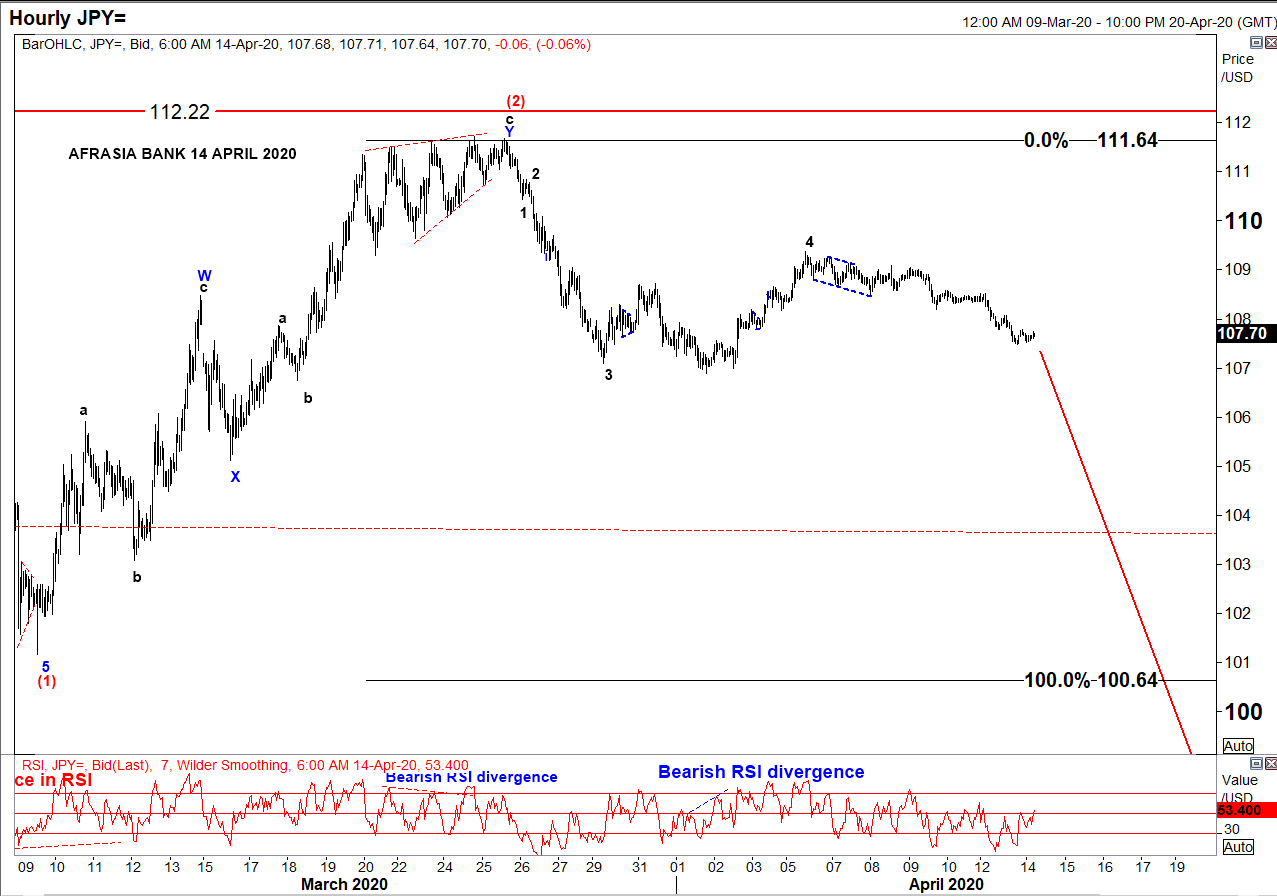
• After rallying to the downside from a high of 112.22 to 101.17 amid global pandemic threat, USD/JPY has been in a correcting mode since 9th March 2020 and seemed to have recently completed an W-X-Y Double Zig-Zag structure of Wave (2) reaching a high of 111.64 on 27th March 2020.
• Two strong indicators were flashing a trend reversal: ending diagonal at Wave 5 of Wave c and bearish RSI divergence.
• On the hourly chart, as per Elliott Wave analysis, the pair might resume its downwards trend targeting 100.64 - 93.78 to unfold Wave (3), a projection of 100%-161.8% of Fibonacci level.
• At 107.70 today, USD/JPY is percolating towards its target from 110.41 to 107.84, as per chart.
• On a side note, resumption of a bullish USD/JPY would mark an invalidation of the Elliott Wave structure above 112.22

Markey update on Biz Week by Christie Ng
Speak to our team
  • Allan Juste
    Head - Forex And Derivatives
    +230 5251 4855
  • Reshma Peerun Rajwani
    Head – Treasury Sales
    +230 403 5500
Disclaimer
Please note that the information published is purely indicative. It is based on technical data from sources which the Bank verily believes to be authentic, though its timeliness or accuracy cannot be warranted or guaranteed. AfrAsia Bank Ltd issues no invitation to anyone to rely on this bulletin and neither we nor our information providers shall be in no way whatsoever, liable for any errors or inaccuracies, regardless of cause, or the lack of timeliness, or for any delay or interruption in the transmission thereof to the user. The indicative rates and other market information are subject to changes at the Bank's discretion. Whilst every effort is made to ensure the information is accurate, you should confirm the latest situation with the Bank prior to making any decisions.