
Your job is not to tell people what to do, but to dictate yourself to helping them do better.
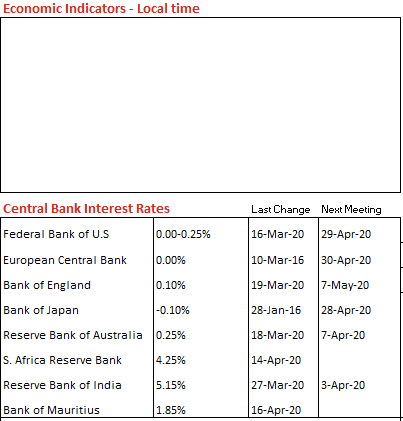
USD
EUR/USD
The shared currency climbed to $1.0845 after French President Macron expressed support for joint Eurozone debt issuance to counter economic impact from Covid-19.
GBP/USD
The Cable tumbled to $1.2450 on critics that UK PM Johnson missed initial emergency COBRA (Cabinet Office Briefing Room A) meetings during the crucial weeks when the virus first arrived in the UK.
USD/JPY
The safe-haven yen receded from high of 107.12 to 107.85 per dollar amid broad-based dollar strength as global growth fears hit oil prices and commodity currencies on early Asian sessions.
AUD/USD
The Aussie consolidated at $0.6350 after China trimmed the one-year loan prime rate by 20 basis points, taking it to 3.85%, and lowered the five-year rate by 10 basis points to 4.65%.
USD/ZAR
The South African rand firmed at 18.87 against the greenback as glimmers of risk appetite returning to global markets.
USD/MUR
The pair idled at 40.25 (selling) on the domestic market.

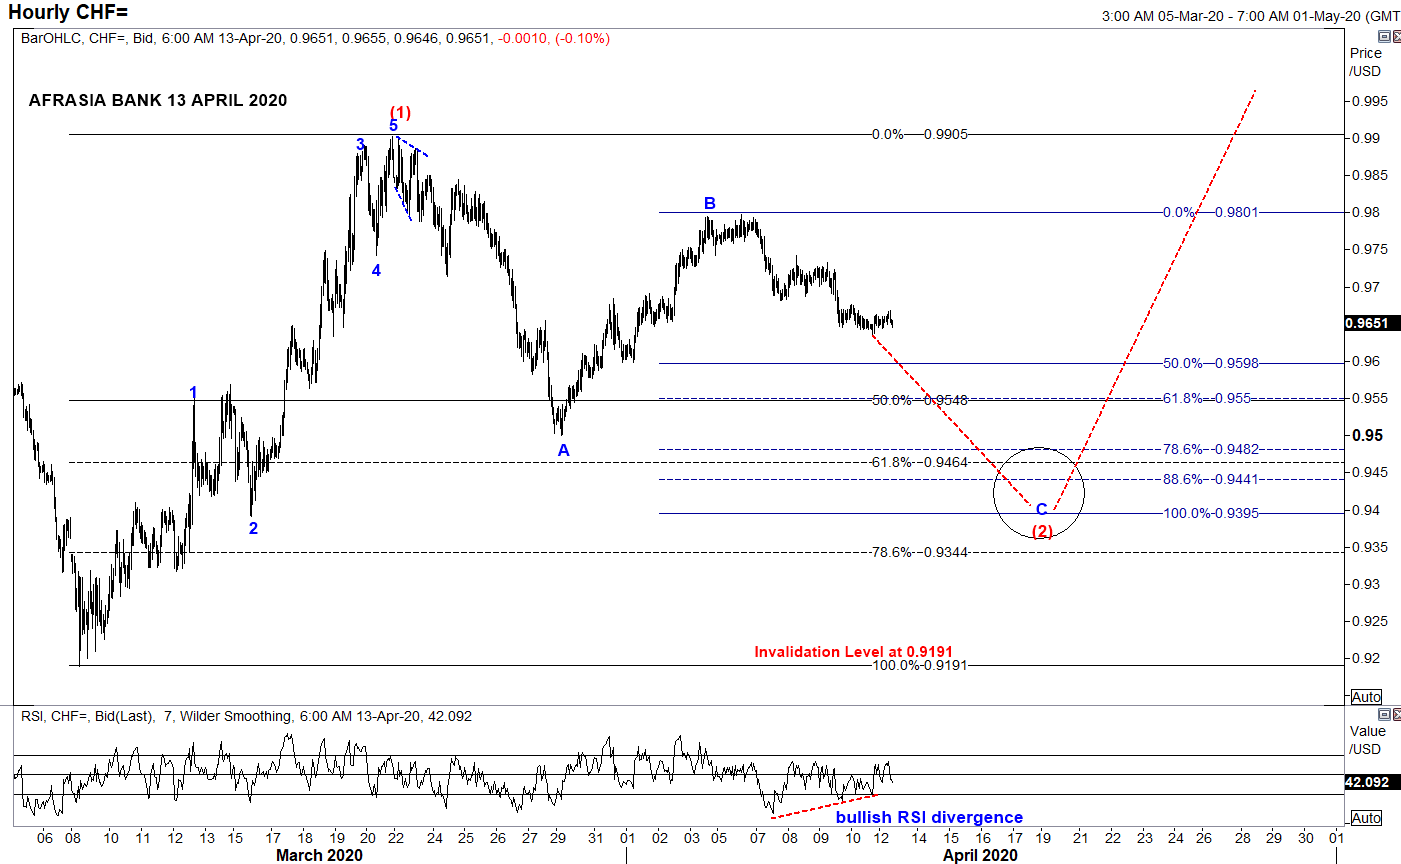
- From an Elliott Wave standpoint, USDCHF could potentially unfold into compelling impulsive Wave C of the zigzag correction of Wave (2) to a narrowing region 0.9550 (50% retracement of Wave (1)) to 0.9395 (100% projection of Wave A through B) in the near term trend, from the downside bias from April 6th high of 0.9797.
- Price could immediately start to shoot back up into Wave (3) on a longer perspective.
- Piercing above the resistance 0.9905 would endorse the structure.
- Alternatively, broader bearish invalidation of Elliott Wave Structure rest at 0.9191 of March 9th low while Relative Strength Index signals a bullish recoil higher for the pair.
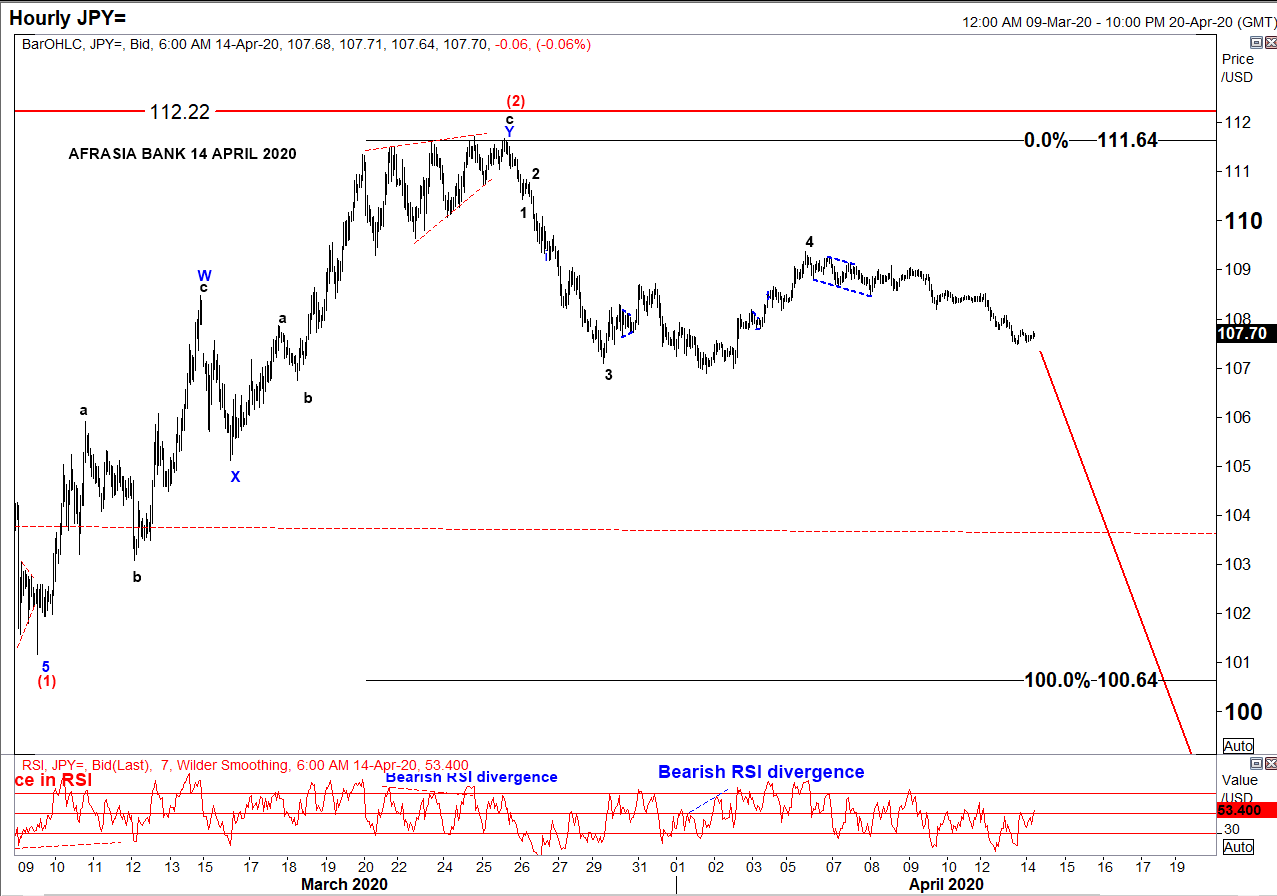
• After rallying to the downside from a high of 112.22 to 101.17 amid global pandemic threat, USD/JPY has been in a correcting mode since 9th March 2020 and seemed to have recently completed an W-X-Y Double Zig-Zag structure of Wave (2) reaching a high of 111.64 on 27th March 2020.
• Two strong indicators were flashing a trend reversal: ending diagonal at Wave 5 of Wave c and bearish RSI divergence.
• On the hourly chart, as per Elliott Wave analysis, the pair might resume its downwards trend targeting 100.64 - 93.78 to unfold Wave (3), a projection of 100%-161.8% of Fibonacci level.
• At 107.70 today, USD/JPY is percolating towards its target from 110.41 to 107.84, as per chart.
• On a side note, resumption of a bullish USD/JPY would mark an invalidation of the Elliott Wave structure above 112.22

