Internet Banking
Click icon again to close

Treasury

Daily Market Patrol

Market Patrol 2 June 2020

Be the change that you wish to see in the world. 

Mahatma Gandhi
Indicative Selling Rates
against MUR
USD
16 Apr 2024
  • AUD
  • 30.59
  • 0.6481
  • BWP
  • 3.48
  • 0.0737
  • CAD
  • 34.48
  • 1.3688
  • CNY
  • 6.61
  • 7.1388
  • DKK
  • 6.81
  • 6.9264
  • EUR
  • 50.34
  • 1.0666
  • HKD
  • 6.12
  • 7.7125
  • INR
  • 0.57
  • 82.2137
  • JPY
  • 30.94
  • 152.5741
  • KES
  • 36.67
  • 128.7205
  • NZD
  • 28.01
  • 0.5934
  • NOK
  • 4.40
  • 10.7360
  • SGD
  • 34.89
  • 1.3527
  • ZAR
  • 2.56
  • 18.4391
  • SEK
  • 4.39
  • 10.7602
  • CHF
  • 52.03
  • 1.1023
  • GBP
  • 58.96
  • 1.2491
  • USD
  • 47.20
  • 1.0000
  • AED
  • 13.05
  • 3.6156
The U.S dollar bleeding on concerns over U.S-China tensions and mass protests in some American states.
Fundamental News

EUR/USD
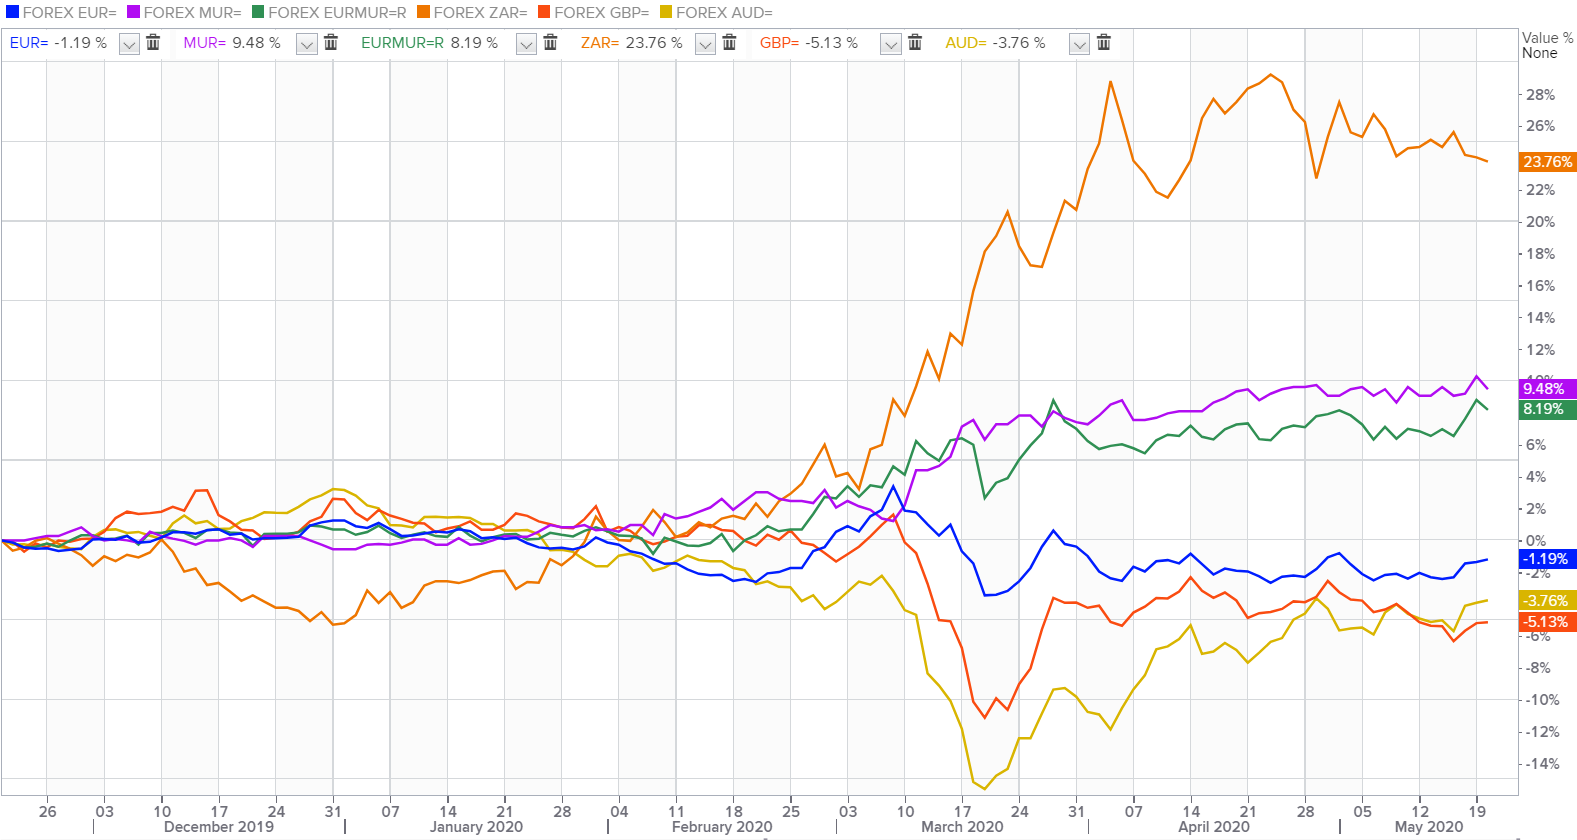
The Single currency capped below $1.1150 on broad dollar weakness due to the escalating US riots while markets remain jittery amid renewed US-China trade concerns.


GBP/USD 
The pound surged to a four-week high at $1.2515, as a risk-on mood in global markets prompted by hopes for an economic recovery caused the safe-haven dollar to weaken, but recovered to $1.2480 weighed down by Brexit-related risks, speculation about negative rates and the fact that the United Kingdom has one of the highest COVID-19 death tolls in the world.


USD/JPY
The Japanese Yen edged lower to 107.70 region when U.S. manufacturing activity eased off an 11-year low in May at 43.1, fitting into markets' expectations that the worst of the economic downturn was behind as businesses reopen.


AUD/USD
The Aussie defied gravity to $0.6810 on reports that China had told state-owned firms to halt purchases of soybeans and pork from the United States. The Reserve Bank of Australia left its interest rate unchanged at 0.25%.


USD/ZAR
South Africa's rand firmed more than 1% at 17.38/dlr on Monday, lifted by hopes of economic recoveries at home and abroad as more countries eased coronavirus lockdowns.


USD/MUR
The Mauritian rupee idled at 40.45(selling) on the local foreign exchange market.

Fundamental & Technical Data
Economic Indicators-Local Time
Central Bank Interest Rates
Last Change
New Meeting
Federal Bank of U.S
0.00-0.25%
16-Mar-2020
10-Jun-2020
European Central Bank
0.00%
10-Mar-2016
04-Jun-2020
Bank of England
0.10%
19-May-2020
18-Jun-2020
Bank of Japan
-0.10%
28-Jan-2016
16-Jun-2020
Reserve Bank of Australia
0.25%
18-Mar-2020
02-Jun-2020
S.Africa Reserve Bank
4.25%
21-May-2020
-
Reserve Bank of India
4.00%
22-May-2020
-
Bank of Mauritius
1.85%
16-Apr-2020
-
Looking for Markets correlation?
Market Correlation is a measure, statistical or observational, that gives a positive or negative link between the pricing of multiple currencies.

Bulls & Bears Levels
Resistance and Support
Levels
EUR/USD
GBP/USD
USD/JPY
USD/ZAR
R3
1.1218
1.2739
108.32
18.40
R2
1.1186
1.2623
108.09
17.81
R1
1.1161
1.2558
107.84
17.99
PP
1.1129
1.2442
107.61
17.50
S1
1.1104
1.2379
107.36
17.23
S2
1.1072
1.2262
107.13
16.58
S3
1.1047
1.2197
106.88
15.92
Technical Analysis - Forex Charts
Safe-haven nature of FRANC SWISS may plummet USD/CHF to a downfall
Chart updated on 13.04.2020
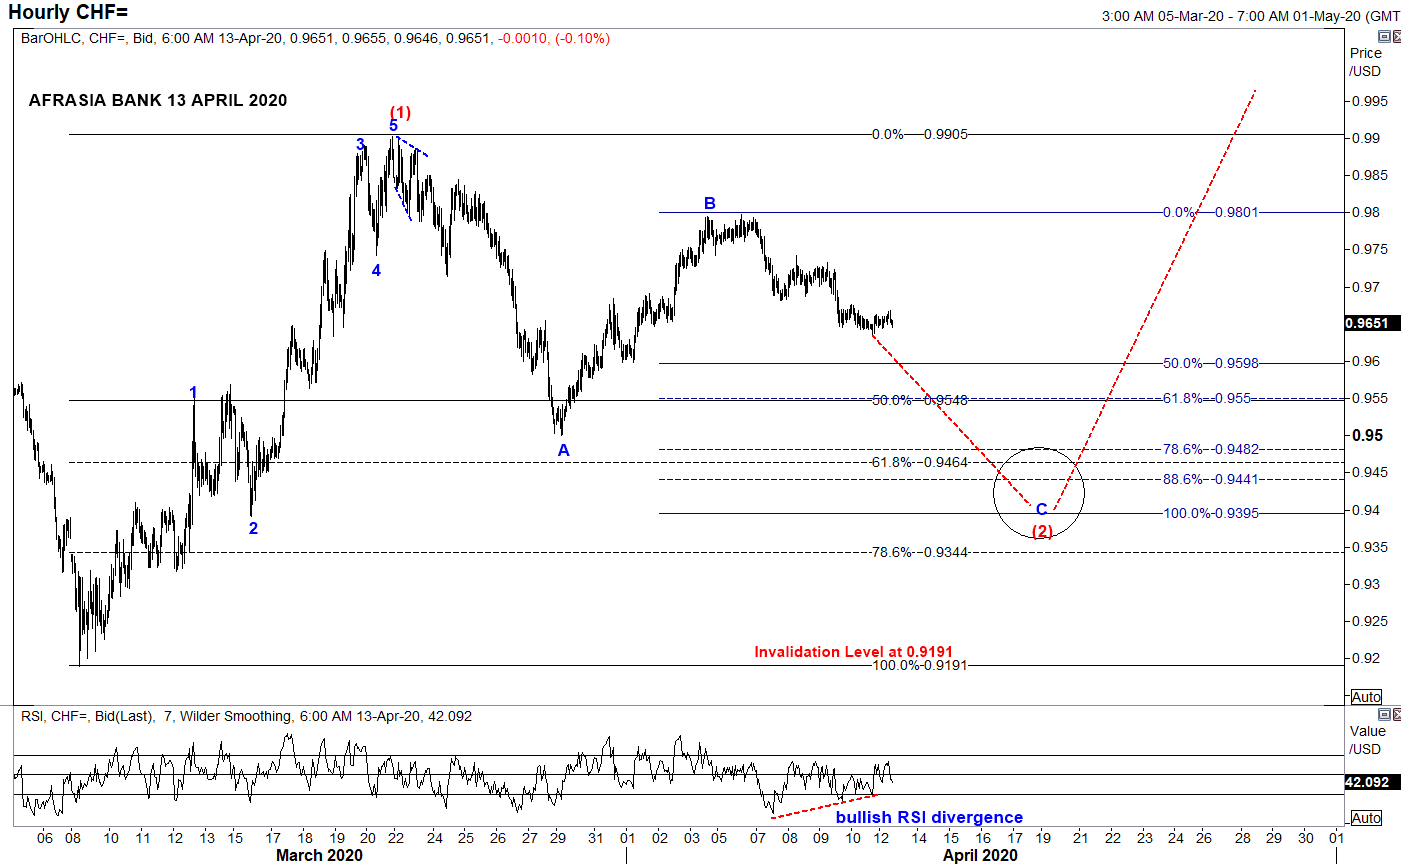
  • From an Elliott Wave standpoint, USDCHF could potentially unfold into compelling impulsive Wave C of the zigzag correction of Wave (2) to a narrowing region 0.9550 (50% retracement of Wave (1)) to 0.9395 (100% projection of Wave A through B) in the near term trend, from the downside bias from April 6th high of 0.9797.
  • Price could immediately start to shoot back up into Wave (3) on a longer perspective.
  • Piercing above the resistance 0.9905 would endorse the structure.
  • Alternatively, broader bearish invalidation of Elliott Wave Structure rest at 0.9191 of March 9th low while Relative Strength Index signals a bullish recoil higher for the pair.
Japanese Yen rebound may fizzle its way back to Safe-haven status
Chart posted on 14.04.2020

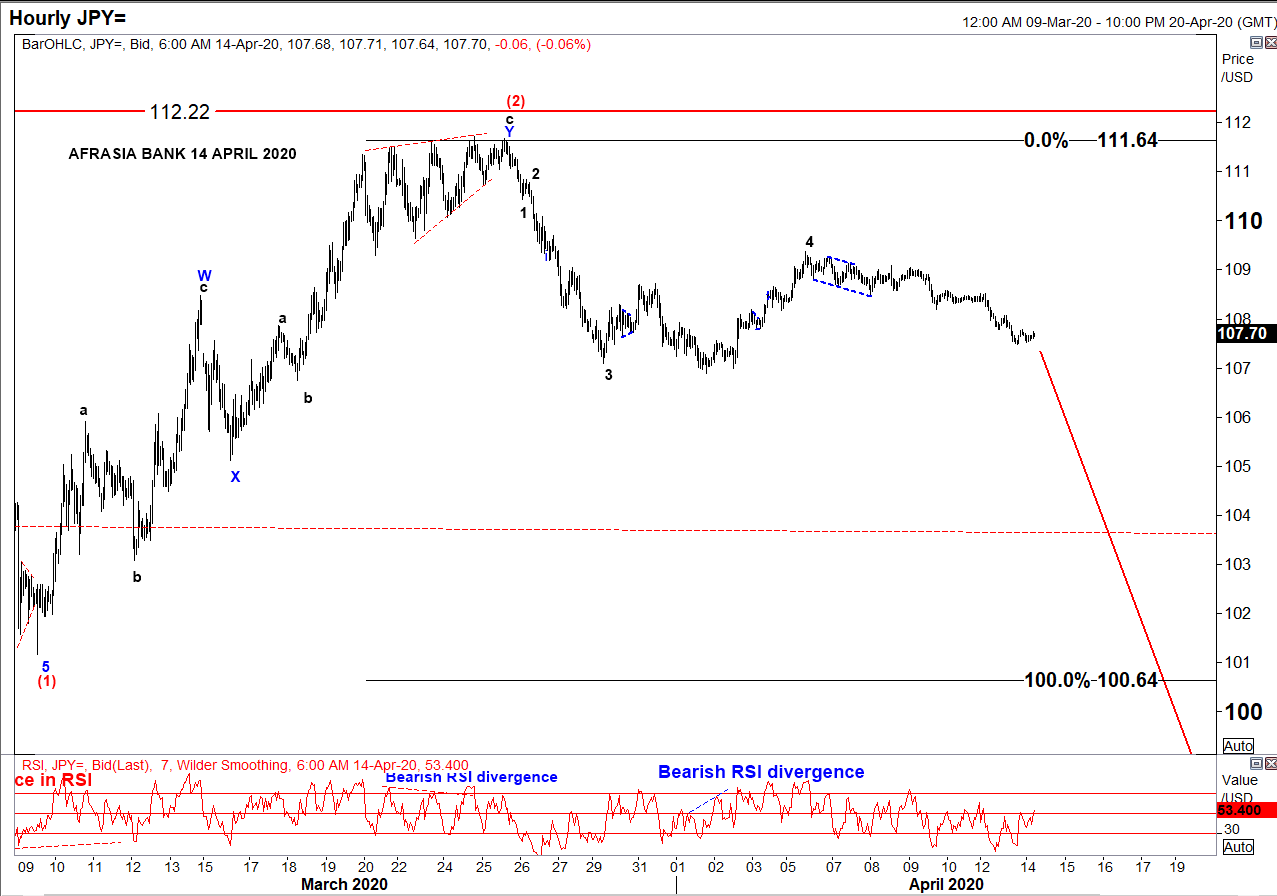
• After rallying to the downside from a high of 112.22 to 101.17 amid global pandemic threat, USD/JPY has been in a correcting mode since 9th March 2020 and seemed to have recently completed an W-X-Y Double Zig-Zag structure of Wave (2) reaching a high of 111.64 on 27th March 2020.
• Two strong indicators were flashing a trend reversal: ending diagonal at Wave 5 of Wave c and bearish RSI divergence.
• On the hourly chart, as per Elliott Wave analysis, the pair might resume its downwards trend targeting 100.64 - 93.78 to unfold Wave (3), a projection of 100%-161.8% of Fibonacci level.
• At 107.70 today, USD/JPY is percolating towards its target from 110.41 to 107.84, as per chart.
• On a side note, resumption of a bullish USD/JPY would mark an invalidation of the Elliott Wave structure above 112.22

Markey update on Biz Week by Christie Ng
Speak to our team
  • Allan Juste
    Head - Forex And Derivatives
    +230 5251 4855
  • Reshma Peerun Rajwani
    Head – Treasury Sales
    +230 403 5500
Disclaimer
Please note that the information published is purely indicative. It is based on technical data from sources which the Bank verily believes to be authentic, though its timeliness or accuracy cannot be warranted or guaranteed. AfrAsia Bank Ltd issues no invitation to anyone to rely on this bulletin and neither we nor our information providers shall be in no way whatsoever, liable for any errors or inaccuracies, regardless of cause, or the lack of timeliness, or for any delay or interruption in the transmission thereof to the user. The indicative rates and other market information are subject to changes at the Bank's discretion. Whilst every effort is made to ensure the information is accurate, you should confirm the latest situation with the Bank prior to making any decisions.