
Coming together is a beginning. Keeping together is progress. Working together is success.
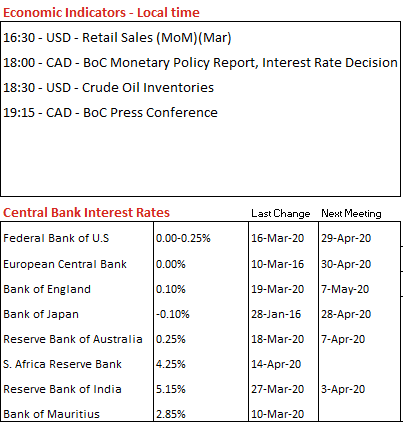
USD
EUR/USD
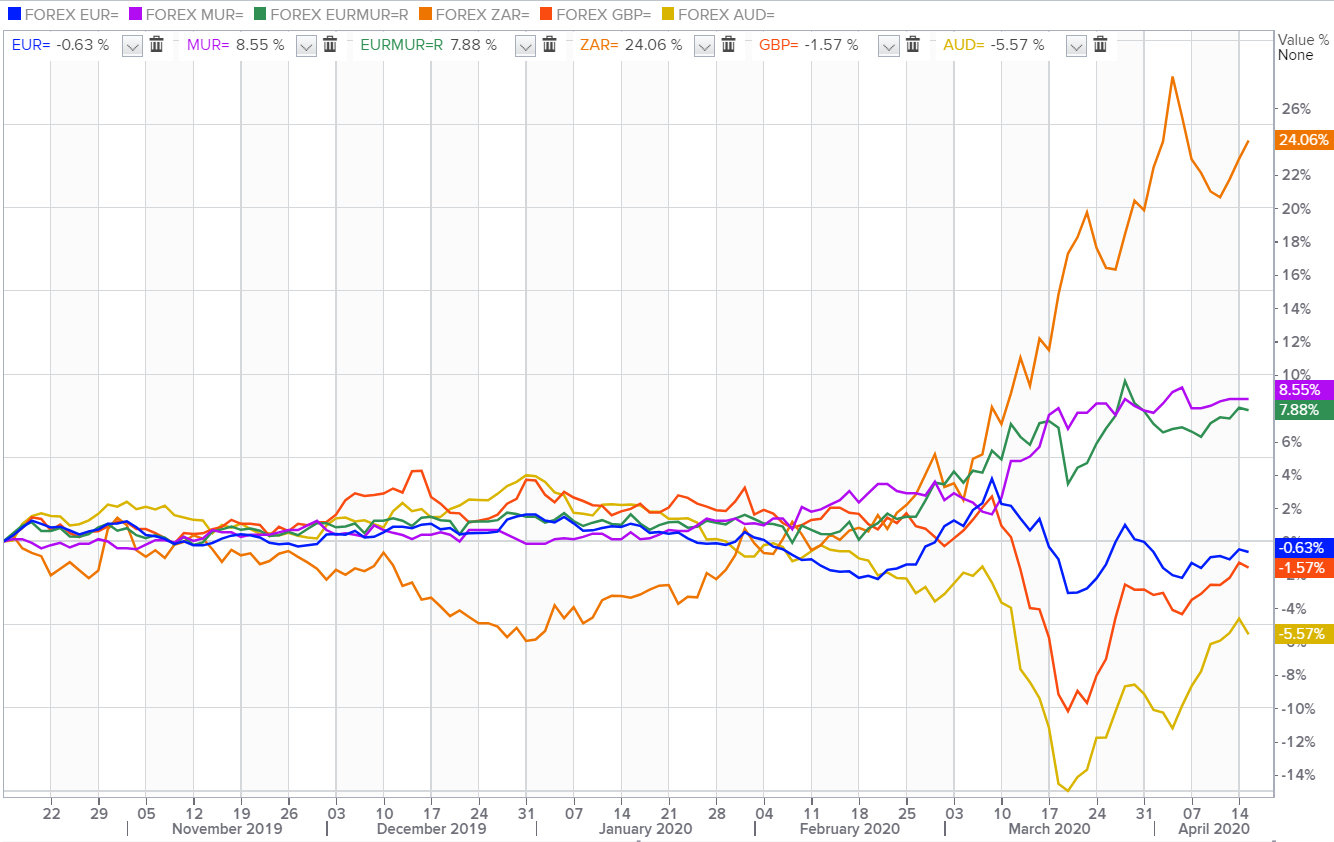
The shared currency clinged to gains at $1.0965 on news that US President Trump planned to reopen the US economy partially before May 1st, amid market is anticipating the Federal Reserve's Beige Book at 22:00.
GBP/USD
The Cable spiked to a month high at $1.2646, benefiting from improved risk sentiment as some countries consider reopening their economies, and ignoring UK Office of Budget Responsibility's (OBR) scenario for a plunge of 35% in economic output in the second quarter and 13% for the full year.
USD/JPY
The safe-haven yen bolstered to 106.91 against the greenback following the International Monetary Fund economic outlook that downgraded global GDP forecast to -3.0% for 2020 and reckoned the deepest global recession since the great depression of the 1930's.
AUD/USD
The Aussie hammered to $0.6383 as Australian consumer sentiment collapsed in April to a 30-year low as social distancing restrictions due to the coronavirus pandemic threatened to push the country's economy into its first recession in three decades.
USD/ZAR
The South African rand plunged to 18.35 per dollar after South Africa Reserve Bank cut repo rate by 100 basis points to 4.25%.
USD/MUR
The pair unfazed at Rs39.95/USD (selling) by US dollar weakness on the domestic market.

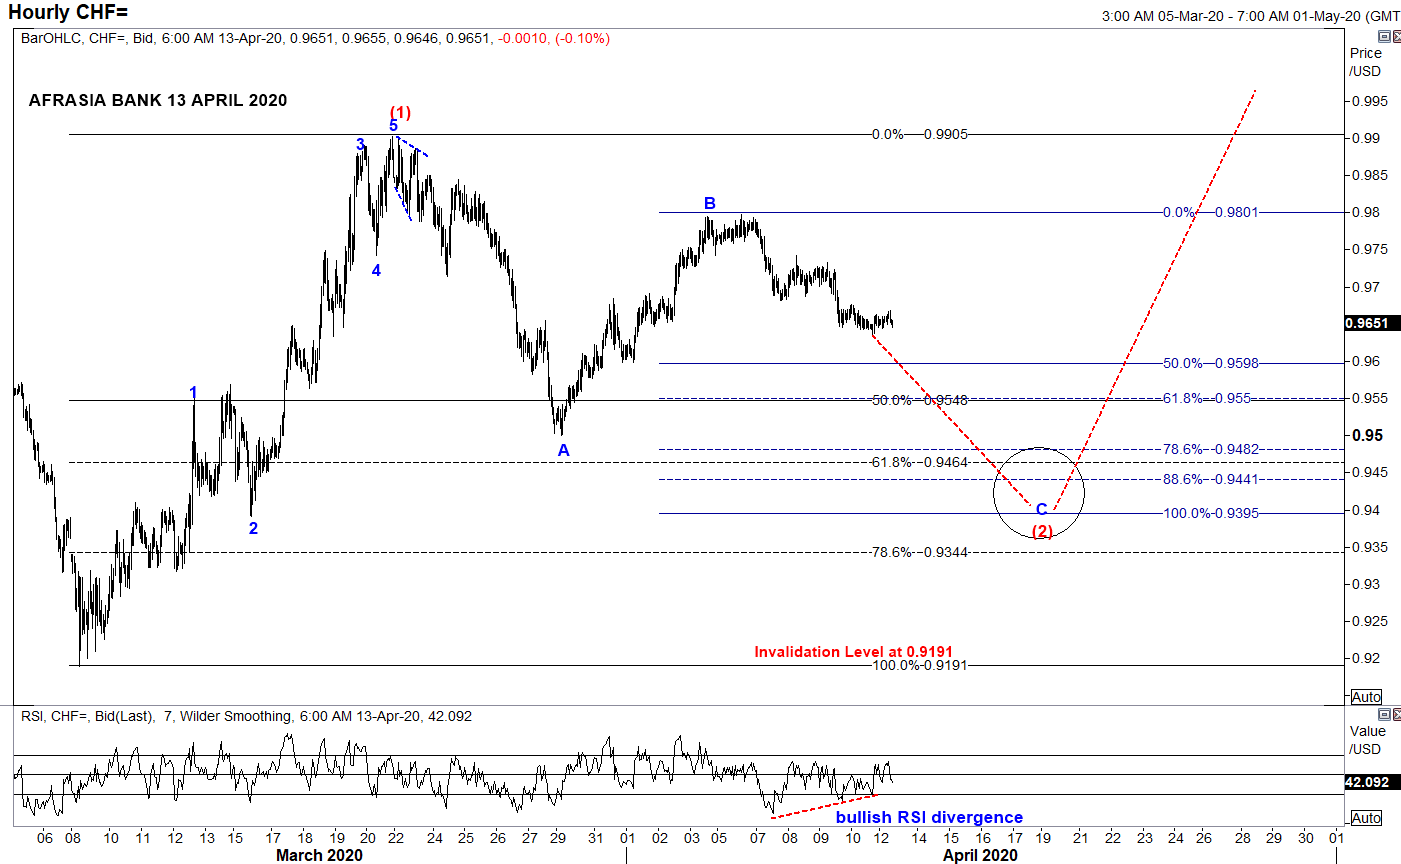
- From an Elliott Wave standpoint, USDCHF could potentially unfold into compelling impulsive Wave C of the zigzag correction of Wave (2) to a narrowing region 0.9550 (50% retracement of Wave (1)) to 0.9395 (100% projection of Wave A through B) in the near term trend, from the downside bias from April 6th high of 0.9797.
- Price could immediately start to shoot back up into Wave (3) on a longer perspective.
- Piercing above the resistance 0.9905 would endorse the structure.
- Alternatively, broader bearish invalidation of Elliott Wave Structure rest at 0.9191 of March 9th low while Relative Strength Index signals a bullish recoil higher for the pair.
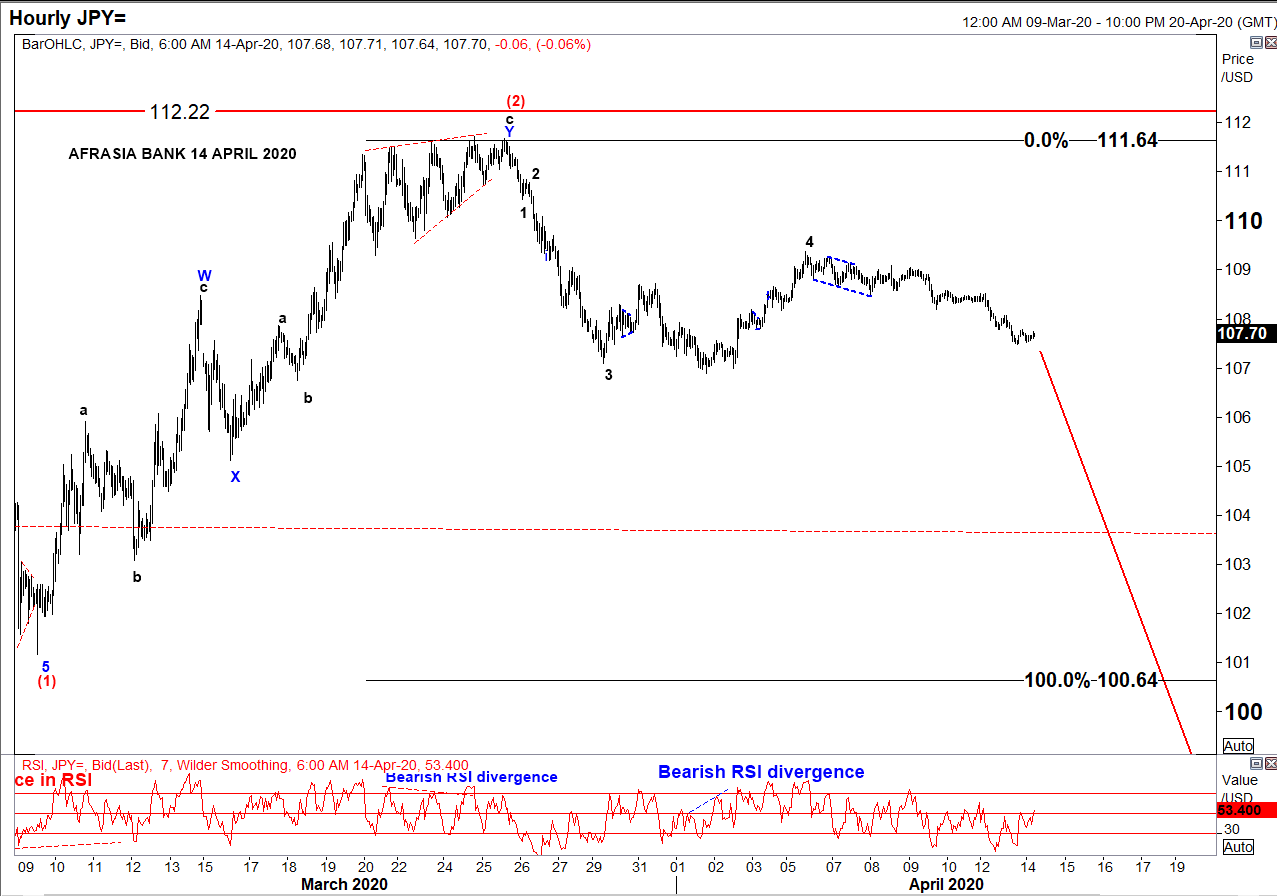
• After rallying to the downside from a high of 112.22 to 101.17 amid global pandemic threat, USD/JPY has been in a correcting mode since 9th March 2020 and seemed to have recently completed an W-X-Y Double Zig-Zag structure of Wave (2) reaching a high of 111.64 on 27th March 2020.
• Two strong indicators were flashing a trend reversal: ending diagonal at Wave 5 of Wave c and bearish RSI divergence.
• On the hourly chart, as per Elliott Wave analysis, the pair might resume its downwards trend targeting 100.64 - 93.78 to unfold Wave (3), a projection of 100%-161.8% of Fibonacci level.
• At 107.70 today, USD/JPY is percolating towards its target from 110.41 to 107.84, as per chart.
• On a side note, resumption of a bullish USD/JPY would mark an invalidation of the Elliott Wave structure above 112.22
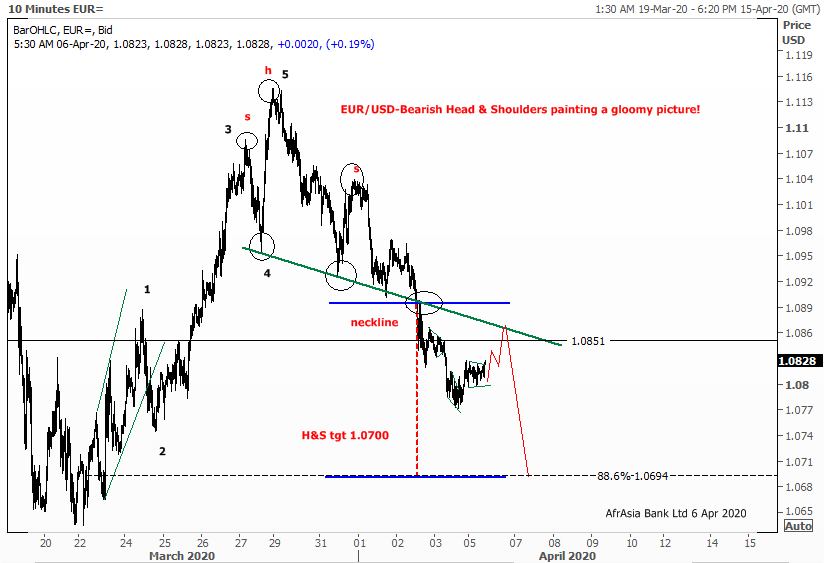
The Single currency plunged to a low of $1.0771 last week, before trimming back some losses to $1.0825 this morning, as safe-haven demand boosted the U.S dollar higher across the board.
On a technical perspective, the EUR/USD appears to be tracking the bearish Head & Shoulders (H&S)pattern highlighted last week.
The H & S neckline, as illustrated on the 10 mins chart, could possibly act as magnet in the coming sessions that would propel the EUR/USD higher near $1.0850/75.
However, the pair still remain vulnerable to further downside possible near $1.0700( H &S target level).

