Treasury
Market Updates

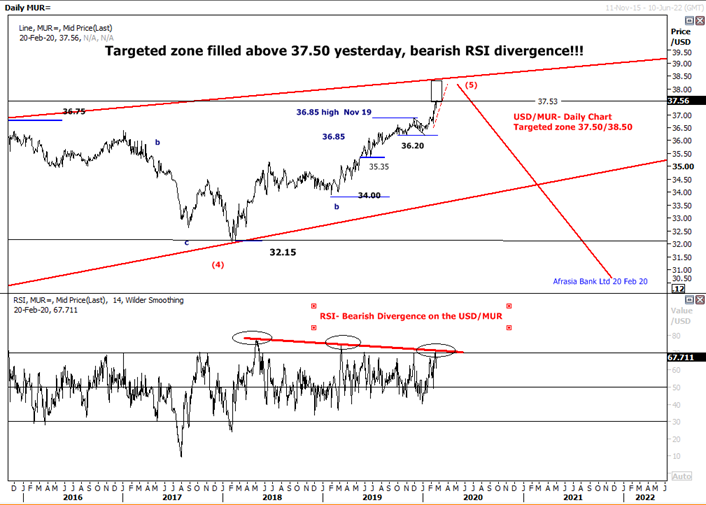
USD/MUR jetted to as high as 37.71 on 19th Feb 20, beware of a bearish RSI divergence!
USD/MUR
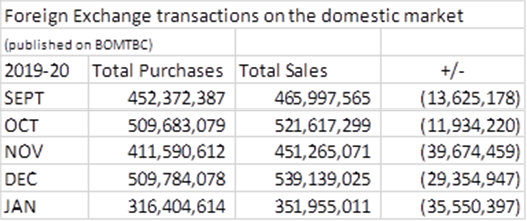
On the domestic market, over the last 6 months, the USD stood tall against the languishing MUR, on the back of heavy demand for FCY from local importers, while the euro’s recent decline to multi-year low underpinned the U.S dollar.
Indeed, the USD/MUR jetted to as high as 37.706 ( selling Dealt rate) yesterday, as published on Bank of Mauritius’ website https://www.bom.mu/markets/foreign-exchange/fx-dealt amid the U.S economy has also proved more resilient than the rest of the world, keeping the U.S dollar unabated across the board.
Technical outlook: Initial targeted zone filled above 37.50, beware of a bearish RSI divergence on the Daily chart!!
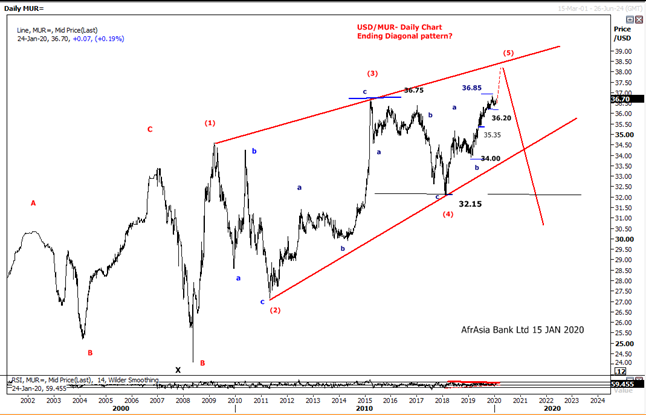
As highlighted in our previous analysis dated 15thJanuary 2020, “the USD/MUR appeared to be travelling in wave 5 of an Elliott wave Ending Diagonal pattern which would send the pair higher in the range of 37.50/38.50”.
Yet, the Daily Chart suggest that the USD/MUR has still scope for further gains in the near term probably near 38.00.
However, the bearish divergence between Relative Strength Index(RSI) and the price action on the USD/MUR Daily Chart reveals that the pair might soon start to lose steam in the coming weeks.
The Relative Strength Index (RSI) is a momentum price-following oscillator that measures the speed and change of price movements over a given time period. This oscillator is designed to identify whether a currency is oversold or overbought and to show reversals and even new trend through so called “Divergence”. A bearish divergence happens when the RSI indicator can’t reach new highs despite a rally in prices.
Read how we anticipated the move on the USD/MUR early in January 2020!!
The USD/MUR has kept a bullish momentum since last year, rising from a low of 33.90 on 1st Feb 2019 to as high as 36.85 yesterday (as published on BOMTBC page), gaining almost 8.7% over a year.
The U.S dollar strength on the domestic market has been mainly supported by a falling EUR/USD combined with an increasing demand for FCY over supply,starting in late Q3 of 2019.
Reuters Rebasing (REBC) - Relationship EUR/USD & USD/MUR
The Reuters rebasing is a useful instrument which graphically shows the relation between EUR/USD and USD/MUR pricing.
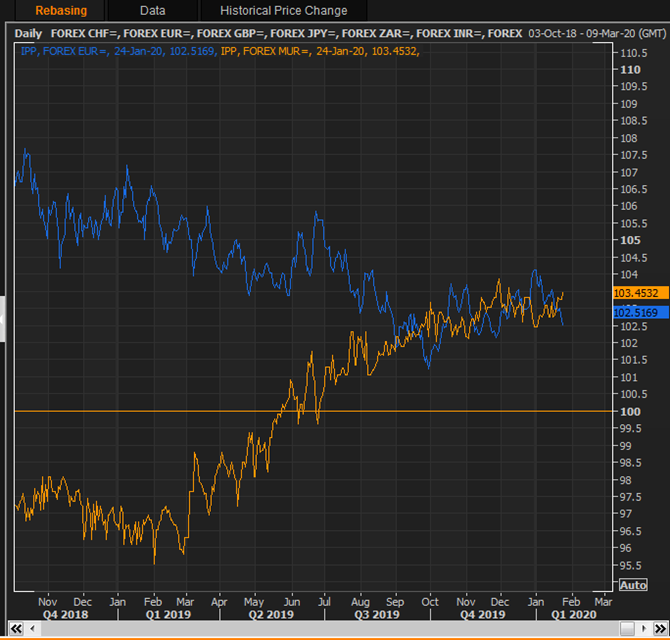
Based on rebasing graph above, from February till August 2019 we have noticed the recurrent inverse relationship between EUR/USD & USD/MUR.
However, both of them have shown a converging tendency in the last quarter of 2019 probably due to the ongoing excess Demand over supply of FCY on the domestic market since September 2019.
Data published on BOMTBC page (REUTERS EIKON)
Technical views:
On the Daily chart, based on an Elliott wave perspective, the U.S dollar appears to be travelling in wave C of wave 5 of an Ending Diagonal with target for end of wave 5 seen in the range of 37.50/38.50.
However, on the long term, we forestall a strong reversal on the USD strength, commonly seen on an Ending Diagonal completion, which could send the pair well below 36.00 followed by 35.35.
Disclaimer: This communication is provided for information and discussion purposes only. Unless otherwise indicated, it does not constitute an offer or recommendation to purchase or sell any financial instruments or other products. AfrAsia Bank does not guarantee or warrant the accuracy, reliability, completeness of the information in this publication.
- Tariff Guide - Non Resident
- Tariff Guide - Resident
- Bank of Mauritius Template on Fees, Charges and Commissions
- Mauritius exits EU list of High-risk third countries on 13 March 2022
- MBA Communique - Mauritius exits UK High-Risk Third Countries list
- MBA Code of Ethics and of Banking Practice
- MBA Communiqué - FATCA
- MBA - KYC Policy Booklet
AfrAsia Bank Limited is regulated by the South African Reserve Bank and the Financial Sector Conduct Authority (FSP 52012)
AfrAsia Bank Limited (Dubai Branch) is regulated by DFSA.
Copyright 2026 AfrAsia Bank Limited. Designed by FRCI