Treasury
Market Updates

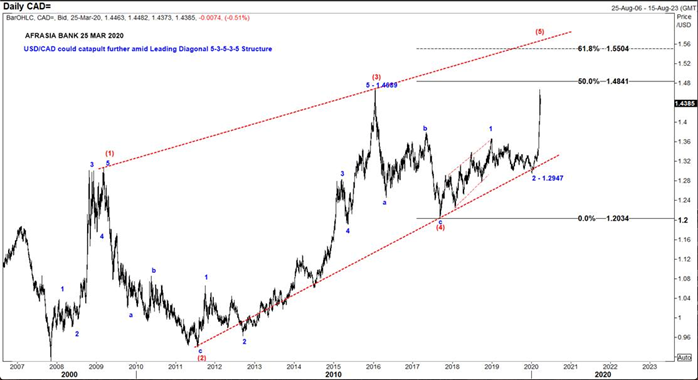
USD/CAD COULD CATAPULT EVEN FURTHER TO AS HIGH AS 1.5504
“The trend is your friend.”
Fundamental News:
Over the last three months, USD/CAD experienced a parabolic climb of nearly 13% to a high of 1.4667 amid the crude oil price crash considering the Canadian economy is highly dependent on oil and energy exports. The oil commodity is trading more than 60% off its year-to-date highs during the COVID-19 outbreak and oil price war sparked by Saudi Arabia.
On Friday March 20th 2020, the Bank of Canada entered a US Dollar swap line arrangement with the US Federal Reserve to boost liquidity and curb the international USD demand. This strategy could alleviate some of the strain recently exerted on the financial system and facilitate a short-term pullback in USD/CAD price action as liquidity is restored.
Even after slashing its policy interest rate by 50-basis points on March 4th 2020 and an additional 50-basis points on March 13th2020 to 0.75%, the Bank of Canada may use its blunt tool again to deliver further rate cut at the next meeting on April 15 as stated by Governor Poloz to deploy other market weapons if required to support growth and keep inflation on target.
Therefore, the Loonie could easily exhibit the bearish behaviour.
Technical Analysis Overview:
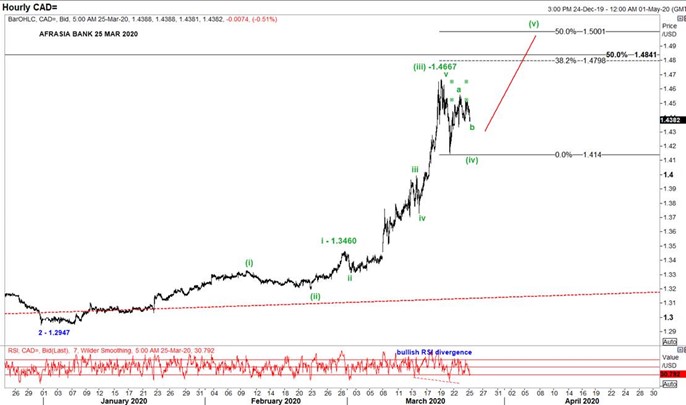
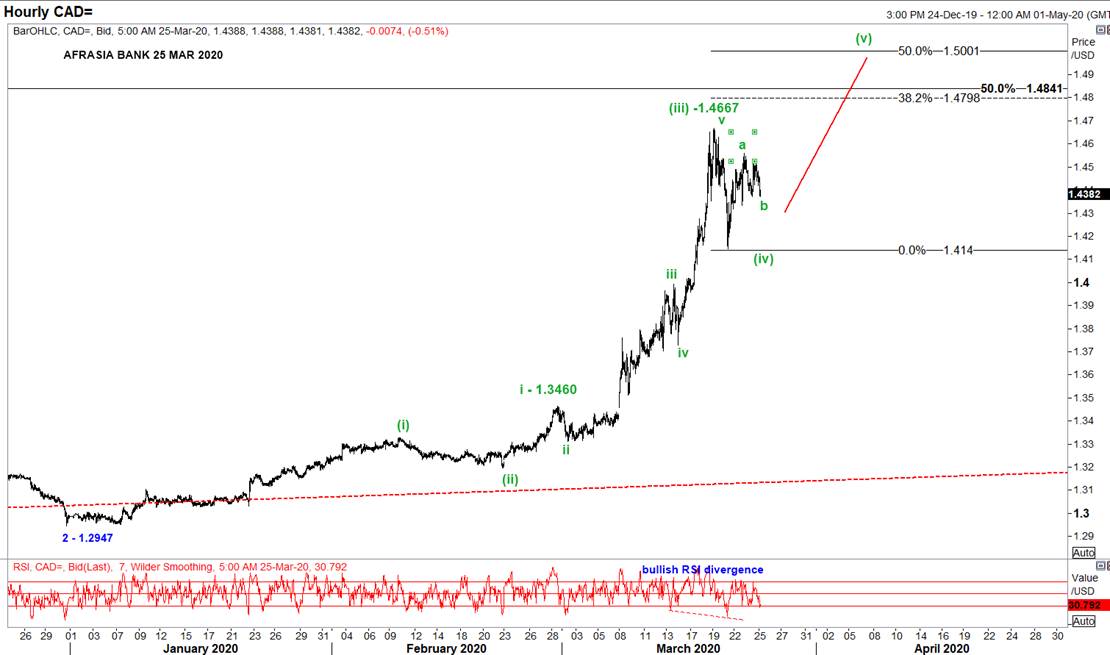
- From an Elliott Wave perspective, the USD/CAD could potentially soar to 1.5504, unfolding Wave (5) of the leading diagonal 5-3-5-3-5 pattern and a 61.8% Fibonacci projection.
- On the daily chart, a break above resistance of Jan 20th 2016 high at 1.4689 would convincingly scope for the flight.

- Zooming in to the hourly chart, USD/CAD may uncoil into a corrective Wave (iv), either a triangle or a flat structure, support at1.414 over the near-term sessions.
- However, from a bigger picture, the pair signals a violent recoil higher in compelling impulse wave (v), reaching a neighbourhood of 1.4798 to 1.5001 as per chart below.
- A re-test at 1.4667 of Wave (iii) would confirm the uptrend trajectory.
- Relative Strength Index divergence flashes a textbook buy signal on the pair.
- On the flipside, invalidation level at 1.3460 of 28th Feb 2020 may likewise mark the end of the rise that paves the way for resumption of the short-term structural decline.
Disclaimer: This communication is provided for information and discussion purposes only. Unless otherwise indicated, it does not constitute an offer or recommendation to purchase or sell any financial instruments or other products. AfrAsia Bank does not guarantee or warrant the accuracy, reliability, completeness of the information in this publication.
- Tariff Guide - Non Resident
- Tariff Guide - Resident
- Bank of Mauritius Template on Fees, Charges and Commissions
- Mauritius exits EU list of High-risk third countries on 13 March 2022
- MBA Communique - Mauritius exits UK High-Risk Third Countries list
- MBA Code of Ethics and of Banking Practice
- MBA Communiqué - FATCA
- MBA Communiqué - New Bank Procedures for Returned Cheques
AfrAsia Bank Limited is regulated by the South African Reserve Bank and the Financial Sector Conduct Authority (FSP 52012)
AfrAsia Bank Limited (Dubai Branch) is regulated by DFSA.
Copyright 2026 AfrAsia Bank Limited. Designed by FRCI