Treasury
Market Updates

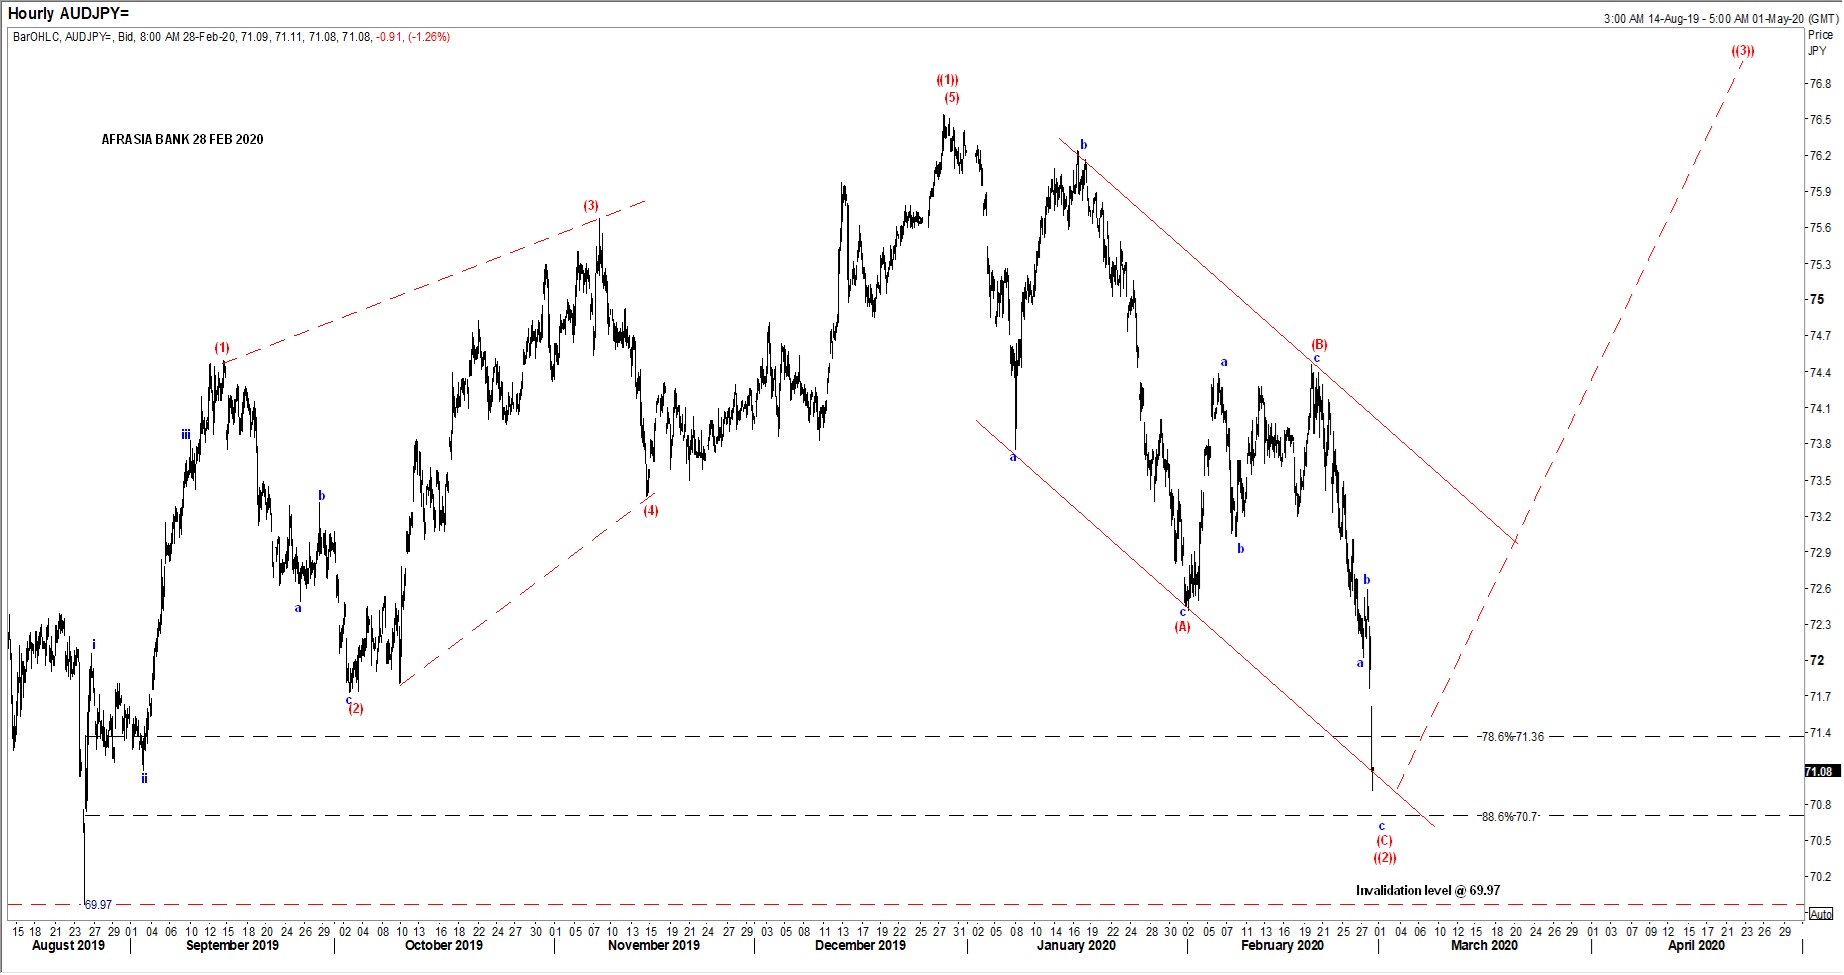
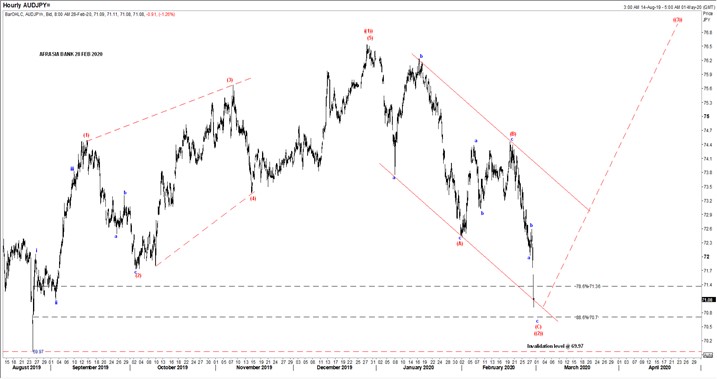
AUD/JPY Elliott Wave Analysis: Price Chart Exposes Bullish Structure to 77.26
From an Elliott Wave perspective, the AUD/JPY signals a violent recoil higher in compelling impulse Wave ((3)) move on a test of support marked by the confluence of a former counter-trend support at 69.97 (invalidation level), formed by the corrective downward (A)-(B)-(C) 5-3-5 zigzag formation brewing since 27th December 2019.
The pair may retrace to 70.70, a 88.6% retracement of the contracting leading diagonal pattern ((1)) to unfold wave ((2)), combined with the downtrend channel connecting wave (A) and (B) that helped cauterize resistance over the last trading days. A resumption of the pair may regain its footing to 77.26 to 81.31 region, matching a projection of 100% to 161.8%.
Disclaimer: This communication is provided for information and discussion purposes only. Unless otherwise indicated, it does not constitute an offer or recommendation to purchase or sell any financial instruments or other products. AfrAsia Bank does not guarantee or warrant the accuracy, reliability, completeness of the information in this publication.
- Tariff Guide - Non Resident
- Tariff Guide - Resident
- Bank of Mauritius Template on Fees, Charges and Commissions
- Mauritius exits EU list of High-risk third countries on 13 March 2022
- MBA Communique - Mauritius exits UK High-Risk Third Countries list
- MBA Code of Ethics and of Banking Practice
- MBA Communiqué - FATCA
- MBA - KYC Policy Booklet
AfrAsia Bank Limited is regulated by the South African Reserve Bank and the Financial Sector Conduct Authority (FSP 52012)
AfrAsia Bank Limited (Dubai Branch) is regulated by DFSA.
Copyright 2026 AfrAsia Bank Limited. Designed by FRCI