Treasury
Market Updates

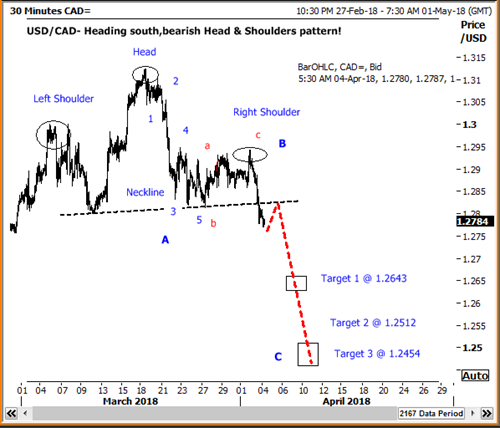
USD/CAD heading south, bearish Head and Shoulders pattern in view!
The USD/CAD turned south yesterday after a report from Bloomberg mentioning that U.S President Trump was looking to reach a deal on NAFTA in two weeks, and he is likely to host cabinet ministers in Washington to try to achieve a breakthrough
The Loonie touched its strongest level since Feb. 28 at C$1.2775 this morning on the back of optimism about the prospect of a NAFTA trade deal. On the 30 mins Chart, the current price patterns suggest for further weakness on the USD/CAD in the short term near 1.2643 followed by 1.2454 ( Wave C of Elliott Wave pattern).
Another technical pattern which is also signalling a potential downturn on the pair is a bearish “Head & Shoulders “pattern, unfolding since early March 2018. The Head and Shoulders pattern is generally regarded as a reversal pattern. Upon a break of the neckline, the price typically fall sharply to a level that is equal to the distance between the Head and the Neckline. The estimated price target based on the H & S pattern is near 1.2512.
On the upside a break above 1.2950 would lead a run to the 1.3000 level followed by the recent high of 1.3125.
Disclaimer: This communication is provided for information and discussion purposes only. Unless otherwise indicated, it does not constitute an offer or recommendation to purchase or sell any financial instruments or other products. AfrAsia Bank does not guarantee or warrant the accuracy, reliability, completeness of the information in this publication.
- Tariff Guide - Non Resident (Applicable as from 15 March 2023)
- Tariff Guide - Resident (Applicable as from 15 March 2023)
- Bank of Mauritius Template on Fees, Charges and Commissions
- MBA Communiqué - Moody’s reviews Government of Mauritius rating
- Mauritius exits EU list of High-risk third countries on 13 March 2022
- MBA Communique - Mauritius exits UK High-Risk Third Countries list
- MBA Communiqué - Le "Skimming" - Clonage des Cartes Bancaires & ATMs
- MBA Code of Ethics and of Banking Practice
AfrAsia Bank Limited is regulated by the South African Reserve Bank and the Financial Sector Conduct Authority (FSP 52012)
Copyright 2024 AfrAsia Bank Limited. Designed by FRCI