Treasury
Market Updates

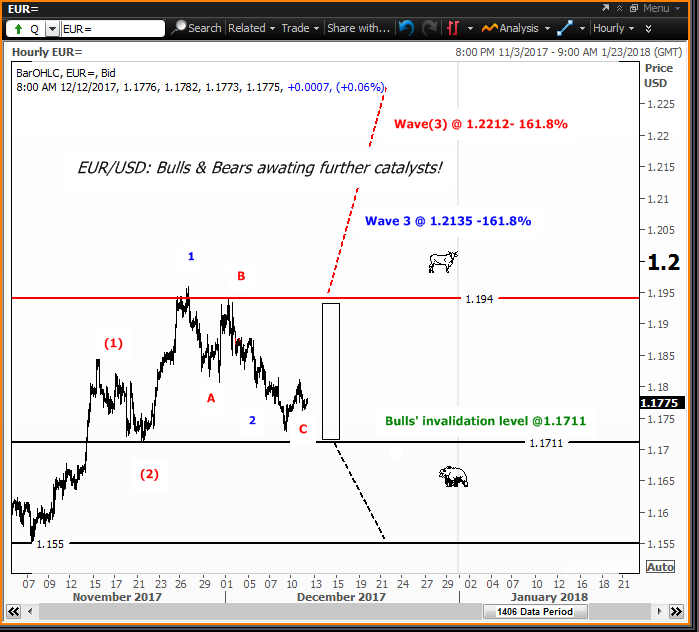
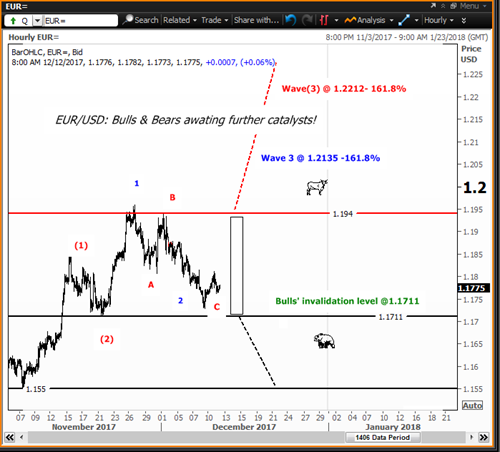
EUR/USD failed to make new progress in the wake of ECB meeting, possible Double zig-zag & Head and Shoulders patterns ahead !
"Invest in yourself. Your career is the engine of your wealth." - Paul Clitheroe
The U.S dollar was sold off across the board on Wednesday even though the Federal Reserve raised interest rate by 25bps to 1.25% to 1.50% as widely expected. The decline on the U.S dollar was attributed to two dissentions from the Fed’s members for a rate hike, while a lack of hawkish surprises in the accompanied FOMC statement also weighed on the greenback.
However, the rally in the Single currency post FOMC meeting failed to get further impetus, following the European Central meeting yesterday. The euro initially peaked at $1.1860 but then reversed sharply below $ 1.1800 after the President of the ECB, Mario Draghi, in his press conference, reiterated that “the monetary policy should remain accommodative as inflation has yet to be self-sustainable”.
Technical outlook- EUR/USD- Possible Double zig-zag & Head and Shoulders pattern (alternate count)
The momentum triggered by the FED on the EUR/USD, late on Wednesday, appears to have receded post ECB meeting yesterday. Though the count on the EUR/USD suggested on 12th Dec is still a valid one, we are, however, currently working on an alternate bearish scenario on the pair, with a double Zig-Zag corrective combination pattern combined with a short term Head & Shoulders pattern, suggesting further decline ahead.
In Elliott wave perspective, a double zig-zag corrective pattern occurs when two separate simple zigzags come together to form the larger corrective structure. On the hourly chart, based on the current structure, the pair has an intermediate support at $1.1627 and a stronger one in the $1.1420 region.
Another strong reversal pattern that could be seen on the EUR/USD Hourly chart is called the “Head and Shoulders pattern.
The formation pattern consists of a price rise followed by a price peak forming the Left Shoulder (1.1711 on 21st Nov. 2017), then a higher peak forming the Head (1.1960 on 27th Nov 2017), before a decline occurs once again to a neckline, followed by a rise forming the Right Shoulder (1.1860 on 14th Dec 17), which is lower that the head. The trend line connecting the lows between the left shoulders, the Head and the right shoulder form a neckline.
Upon a break of the neckline, the price typically fell sharply to a level that is equal to the distance between the head and the neckline. On the Hourly chart, the estimated price target down on the H&S pattern is near $1.1500/1.1470. On the other hand, a move back above $1.1940 would invalidate the bearish count!
Disclaimer: This communication is provided for information and discussion purposes only. Unless otherwise indicated, it does not constitute an offer or recommendation to purchase or sell any financial instruments or other products. AfrAsia Bank does not guarantee or warrant the accuracy, reliability, completeness of the information in this publication.
- Tariff Guide - Non Resident (Applicable as from 15 March 2023)
- Tariff Guide - Resident (Applicable as from 15 March 2023)
- Bank of Mauritius Template on Fees, Charges and Commissions
- MBA Communiqué - Moody’s reviews Government of Mauritius rating
- Mauritius exits EU list of High-risk third countries on 13 March 2022
- MBA Communique - Mauritius exits UK High-Risk Third Countries list
- MBA Communiqué - Le "Skimming" - Clonage des Cartes Bancaires & ATMs
- MBA Code of Ethics and of Banking Practice
AfrAsia Bank Limited is regulated by the South African Reserve Bank and the Financial Sector Conduct Authority (FSP 52012)
Copyright 2024 AfrAsia Bank Limited. Designed by FRCI