Treasury
Market Updates

EUR/USD- Triangle Breakout Last Week And Head & Shoulders Pattern Suggest Further Decline Ahead
“Formal education will make you a living, self-education will make you a fortune."- Jim Rohn
Last week, the U.S dollar has had its best fortnight for more than a year against a basket of currencies, as signs of continued strength in the U.S economy bolstered expectations for a Federal Reserve rate hike before year-end. The case for a December hike was supported by hawkish comments from the Fed member Eric Rosengreen on last Friday. He stated that “the market’s pricing of a December hike sounds about right and that the FOMC might hike rates faster that the market is pricing in”. Besides, the CME Group Fed watch tool, which have long been used to express the market’s views on the likelihood of changes in U.S. monetary policy, is now signalling the probability of a December rate hike at 64%.
However, the tone was less favorable to the dollar this week as investors took profit from recent gains, following poor U.S economic released published on Monday.
Nonetheless, the focus this week will turn increasingly to the most awaited European Central Bank’s rate decision meeting on Thursday (12:30 GMT). Lot of attention will be afforded to ECB President Draghi’s comments on a potential Quantitative Easing extension in December which could see another slide on the Euro. While, the possibility of the ECB tapering their Asset Purchasing Program could send the euro soaring higher.
Short term- EUR/USD corrective pullback near $1.1120/1.1200
The single currency fell below $ 1.1000 for the first time in almost three months last week after strong U.S retail sales and producer price data underpinned the greenback. But the pair recovered from a low of $1.096 on Monday to sit above the $1.1000 handle amid broad based USD selling. On the hourly chart, the recent decline may have momentarily bottomed last week, and a corrective setback near 1.1120/1.1205 (50-78.6% Fibo retracement) might prevail in the short term.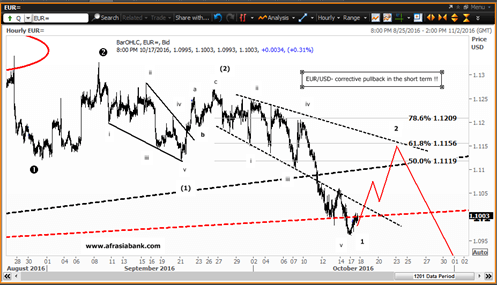
Medium term- Triangle breakout last week and Head & Shoulders pattern suggest further decline ahead.
On the daily chart, after stagnating in a narrowest range of $ 1.1124- 1.1362 against the U.S dollar during the last quarter, the euro may have finally turned bearish, following breaking out from the Contracting triangle formation ,where the pair was trapped into a sideways price movement over the last 18 months. Technically, the thrust out from the converging trend line that connected the extreme of wave B and D of that triangle at $1.1090 on 11th of Oct 16 may have set the pace for a lower euro in the medium term to $1.0457 (low posted on 13th of March 15).
Another technical pattern which is also signalling a potential negative outlook on the EUR/USD is a bearish “Head & Shoulders pattern” (H & S), unfolding since December 2015. The head and shoulders pattern is generally regarded as a reversal pattern. The formation pattern consists of a price rise followed by a price peak forming the Left Shoulder (1.1310 on 10th Feb 2016), then a higher peak forming the Head (1.1536 on 3rd of May 2016), before a decline occurs once again to a neckline, followed by a rise forming the Right Shoulder (1.1362 on 19th of August 16), which is lower that the head. The trend line connecting the lows between the left shoulders, the Head and the right shoulder form a neckline. Upon a break of the neckline, the price typically fell sharply to a level that is equal to the distance between the head and the neckline. The estimated price target on the H & S pattern is near $1.0300/50. 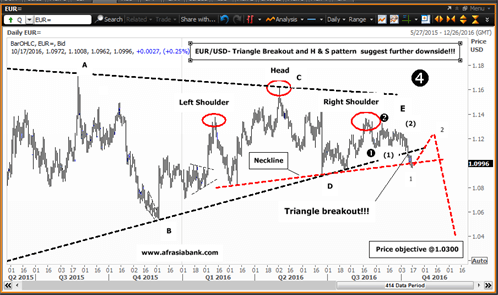
CONTACT US
Interested in Forex ,Bonds ,and structured products?
Please feel free to email us or give us a call. Our dedicated team looks forward to advising you on our suitable customized and structured solutions to meet your specific hedging and investment requirements on different asset classes.
FX-Treasury@afrasiabank.com
- Tariff Guide - Non Resident (Applicable as from 15 March 2023)
- Tariff Guide - Resident (Applicable as from 15 March 2023)
- Bank of Mauritius Template on Fees, Charges and Commissions
- MBA Communiqué - Moody’s reviews Government of Mauritius rating
- Mauritius exits EU list of High-risk third countries on 13 March 2022
- MBA Communique - Mauritius exits UK High-Risk Third Countries list
- MBA Communiqué - Le "Skimming" - Clonage des Cartes Bancaires & ATMs
- MBA Code of Ethics and of Banking Practice
AfrAsia Bank Limited is regulated by the South African Reserve Bank and the Financial Sector Conduct Authority (FSP 52012)
Copyright 2024 AfrAsia Bank Limited. Designed by FRCI